An introduction to Google Analytics
Over the last few months, the digital communications team have been redesigning areas of the website, such as the newly designed postgraduate taught pages and in the past, the homepage. When making such changes, it is useful and important for us to measure the impact they have on content and user experience. To do this, we use Google Analytics before and after a significant change to monitor how the site has been affected by the change.
What is Google Analytics?
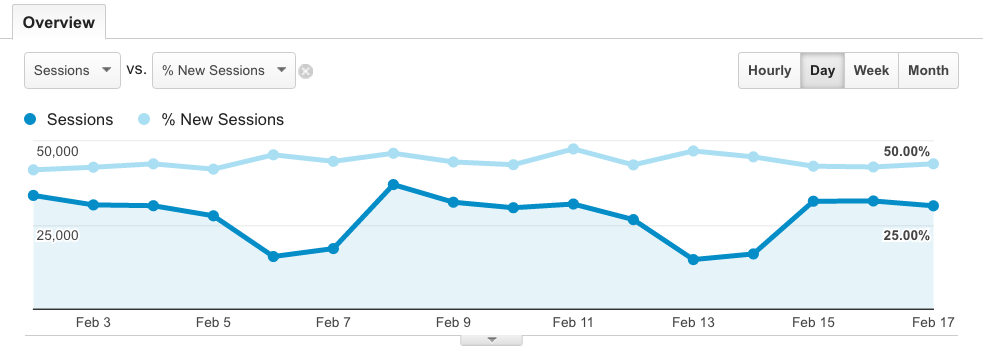
Google Analytics is a free web analytics tool which provides data from a website through data visualisation tools and detailed reports. Google Analytics allows us to not only see how many people visited a site, but also when they visited, how long they stayed, what they clicked on, what browser they were using, and whether they were viewing your site on their phone. And that’s just scratching the surface.
Why Google Analytics?
Some benefits of using Google Analytics include:
- Detailed information about your audience at your fingertips
- Information highlighting how your audience uses a site
- Customisable reports and data visualisation
- Goals to measure success
- It’s free
Not only is the tool free, but Google have released detailed training guides and content through the Google Analytics Academy, which is also free.
Here’s a good video which highlights why it might be a good idea to get Google Analytics set up if you haven’t already:
Key information Google Analytics can provide
User experience
By understanding how visitors use your website, you can determine areas where a website could be improved in order to streamline user experience. For example, Google Analytics can show you the percentage of your audience who visit your site on their mobile or on a tablet. If your site isn’t optimised for mobile, you could be losing potential leads. However, if the data shows that only 1% of visitors are viewing it on a mobile, it’s probably ok to prioritise maintaining or upgrading the current version of your site over mobile optimisation.
What content works best
Creating and tailoring content that it is useful for your audience is likely to encourage more engagement and increase traffic. Identifying your most and least popular content in Google Analytics enables you to create content which more accurately meets your audience’s needs. Creating helpful content could help increase traffic and user engagement.
The impact of social media
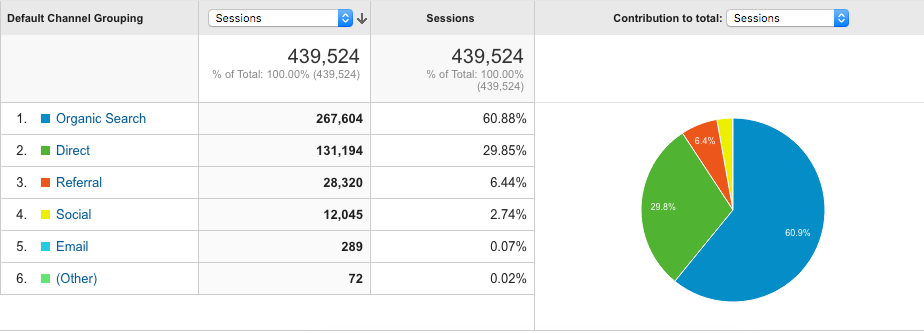
Google Analytics allows you to see how many people are coming to your site from a range of social sites, such as Facebook, Twitter, LinkedIn, etc. You can also see which pages from your site are the most popular with social media users. If you’ve set up social media plugins, you’ll also be able to see how many people interacted with these and when.
Goal completion
Goals can be set to understand specific events such as content downloads or when a specific location is visited, like a ‘thank you’ page. For example, if you want people to spend at least 3 minutes on your site, it could be a good idea to set a benchmark with a goal to measure just how many people are spending that amount of time. Analysis of the goal completion rate (aka the conversion rate) for this goal would highlight whether your site is working how you expect or not.
Conclusion
Whether you have an established website that receives millions of visits per month, or if you’ve just created a website that has fewer than 100 hits per month, Google Analytics can provide a valuable insight into your audience and help fine-tune your site to meet the needs of your users.