Benchmarking the Study webpages
Over the next few weeks the new Subject and undergraduate course pages will go live and Course Search will be taken down. With such a drastic change about to occur on the University’s website it’s crucial that we monitor any impact these changes have. This corresponds with the digital communications team’s commitment to putting user needs first.
One way of monitoring the effects of the new webpages is by measuring specific Google Analytics data relating to the Study section of the website before the changes are implemented. Then, further down the line this data will be used as a point of reference.
What the report showed
Two time scales were used: one month (November 2016) and one year (2016). The report provided an overview of the Study webpages and looked into:
- user flow
- user location
- traffic sources
- devices used.
Overall in 2016, the Study webpages received 5,473,817 pageviews, a total of 17% of the pageviews of the entire website. Of this, 96% (5,259,350) where external users.
These figures were mirrored in November where, the Study webpages received 567,342 pageviews, a total of 21% of the pageviews for the entire website, where, 95% of those users were (544,507) were external.
As the new Subjects pages will be linked to from the Study pages, it is important to note the current pageview data for Study. Going forward, we expect to see an increase in pageviews in Study after the instalment of the new pages.
User flow
We expect that user flow will be altered with the arrival of the new pages. Currently the most popular path for users is the University Homepage> Study> Undergraduate Study.
In 2016, 80% of users accessed the main Study pages from the University’s homepage, 14% accessed the main Study pages from other University pages and 6% of users accessed the Study page directly.
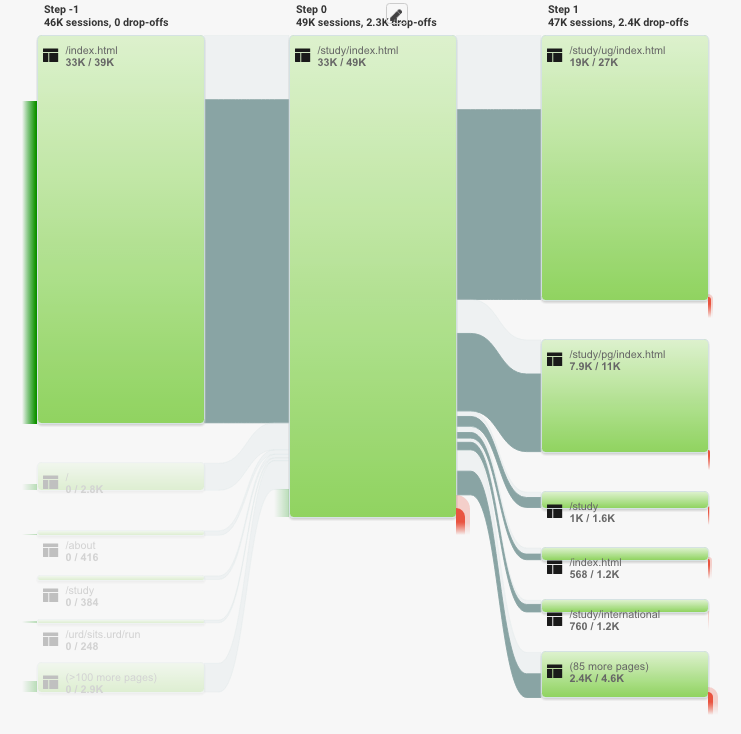
After landing on the Study homepage, 94% of those users continued to another page within the website. Of that 95% however, only around 70% went on to view another page within Study.
When the new pages are established, the route could change to something more specific such as Study>Subjects>Maths for a prospective undergraduate student.
Traffic sources
In November and across 2016, the majority of traffic was the result of organic searches in Google. The chart below summarises the top traffic sources to the Study pages.
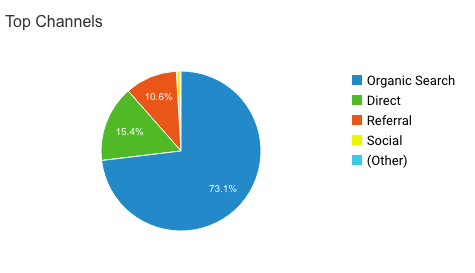
One interesting find was the high portion of referrals within the top 25 sources of traffic. On a yearly basis, referrals made up 68% of the top 25 traffic sources, highlighting the importance of links on external websites for users as an entry route.
User location
Overall, the main users of Study are in the UK. This has increased from 2015 by 7.7% (1,871,600 to 2,015,377). Other notable increases from countries include China (up 28% from 152,046 to 195,548) and India (up 21% from 92,076 to 111,672 pageviews to study).
Users in the USA viewed fewer pages in Study in 2016 compared with 2015 as page views were down 14%. It will be interesting to see if these trends continue next year.
It was also interesting to note the substantial drop in pageviews from countries following the UK and the USA. Across the year there was a 74% difference in pageviews between the USA and China.
Devices used
Users predominately accessed the Study pages via desktop, and if they were to use a mobile device, an actual mobile was preferable to a tablet.
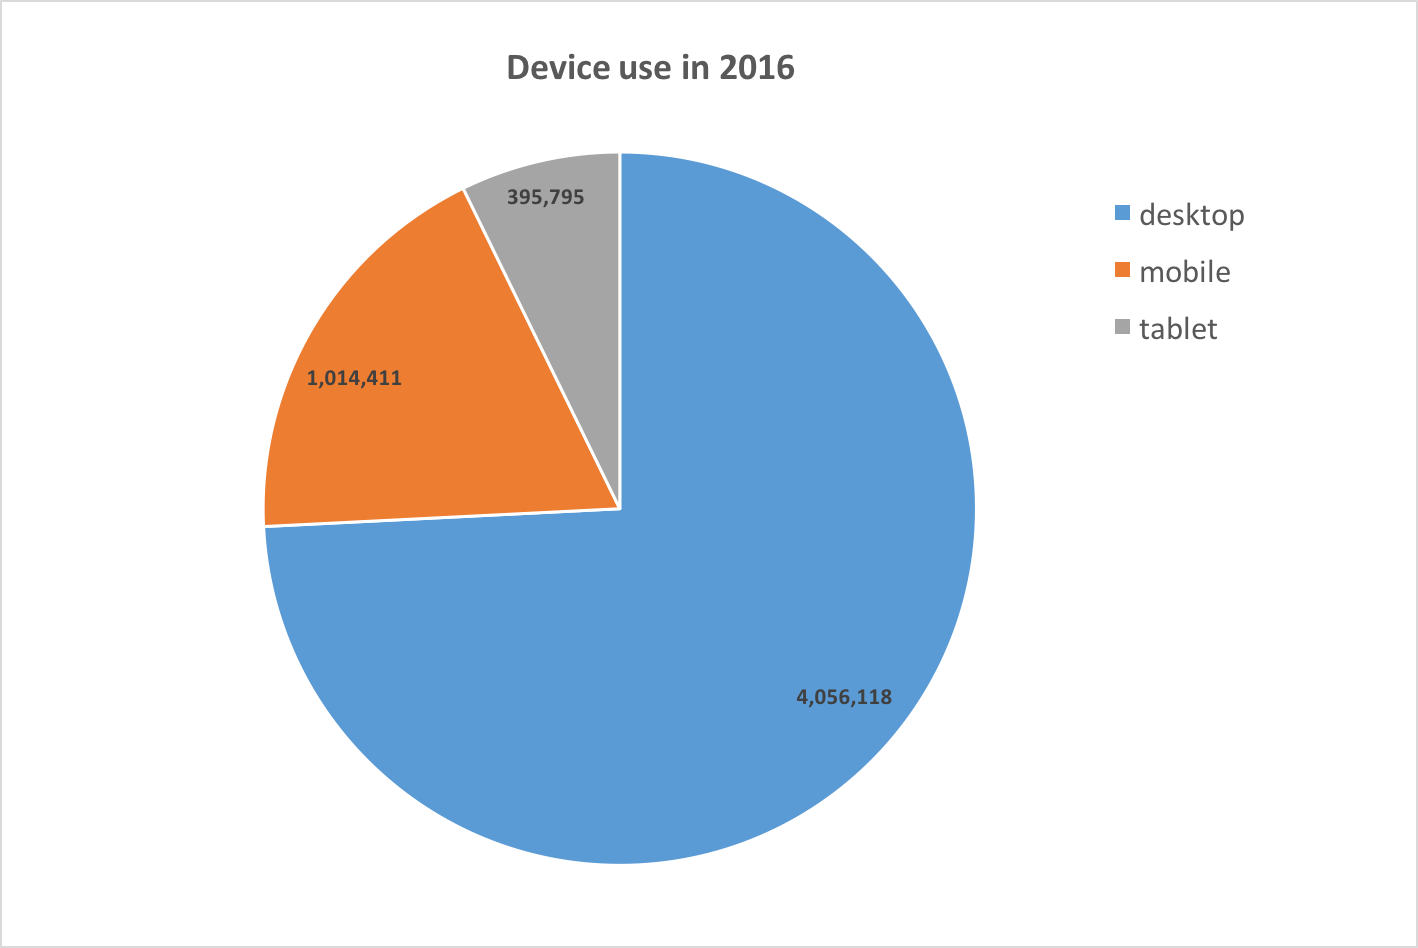
In 2016, mobile and tablet use made up around 25% of the pageviews the Study pages received. In November 2016 mobile and tablet use made up around 25% of the pageviews the Study pages received.