Student portal design sprint findings
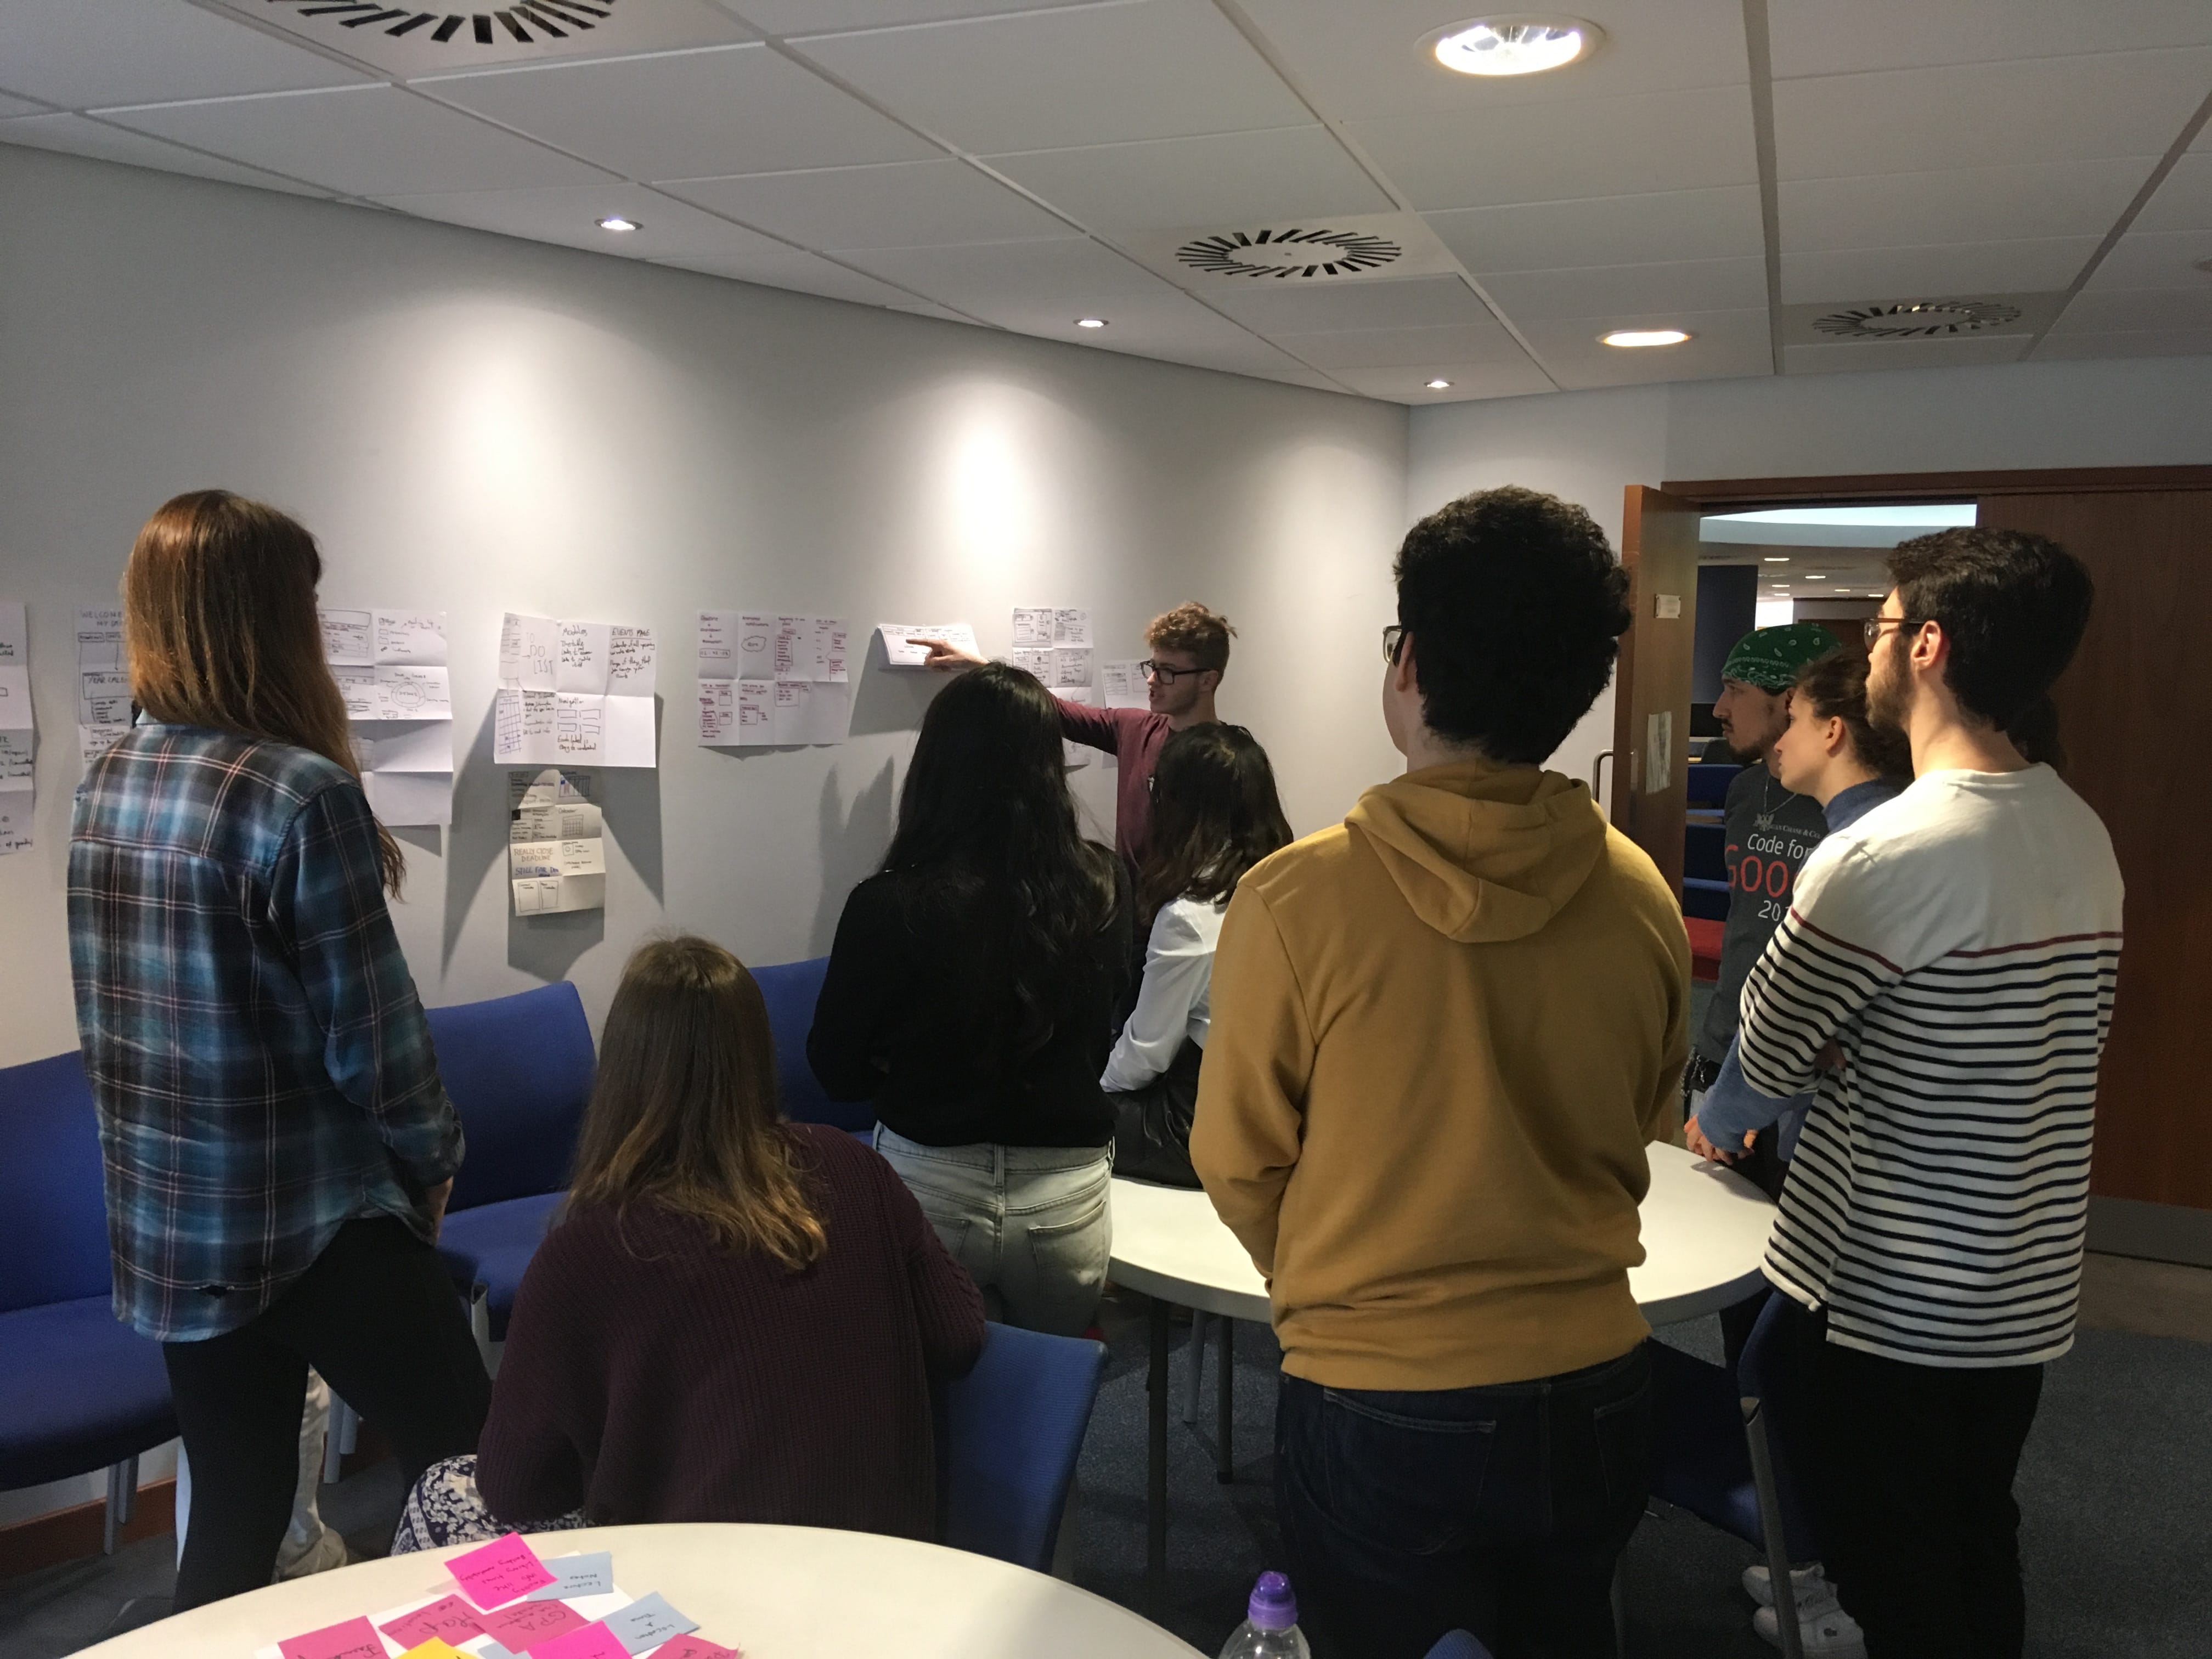
As part of the Technology Enhanced Learning (TEL) project, the digital communications team hosted a design sprint with students to help redesign certain elements of the student portal. Currently, students access teaching and learning information across a variety of platforms including MySaint, ‘MMS’ (Module Management System) and Moodle. The TEL project seeks to unify the systems by creating a ‘one-stop-shop’ for students to access all student information in one place.
Running a design sprint allows us to remove any assumption we have about what the end user expects to see. The sprints are also a way to discover new and unique ideas to solve problems, while also providing an opportunity to meet the end user and gain an understanding of the UX (user experience) problems they face.
The problem
In order to come up with a suitable solution, the sprint attendees needed to know what the problem was that they needed to solve. The problem we wanted to solve was: how do we improve the student learning and teaching space?
Currently module information is split across different systems – there’s no “one-stop shop” for students to access vital information integral to their student experience.
We used survey and usability test data to back this up. For example, some survey respondents had commented:
- “Give up on MySaint. It’s awful and seemingly provides nothing of any use.”
- “Focus on either Moodle OR MMS, because when some lecturers use one, and others use the other it becomes very confusing.”
- “MMS and MySaint / Moodle seem to serve similar purposes. It doesn’t make sense to have both of them operating, and leads to frequent confusion when attempting to access lecture materials.They should be combined into one system – it would save a lot of time”.”
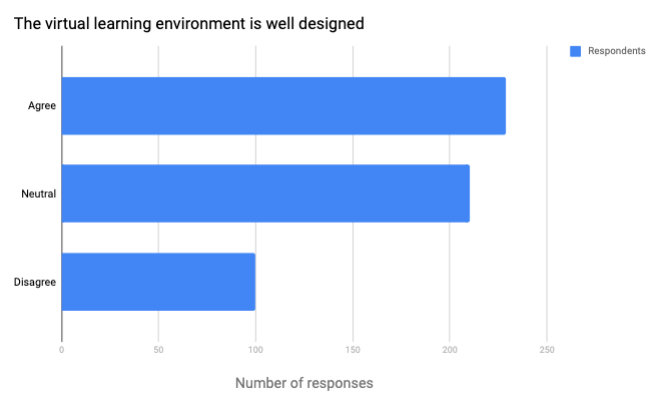
There were 541 responses to the survey. 42.5% of respondents actually agreed that the virtual learning environment is well designed. The remaining 58% were either neutral about the statement (39%) or disagreed with it (18.5%). There are some obvious positives to take from these figures, but we feel that we need fewer people feeling negative or merely neutral about a process which shapes a significant part of their student experience.
The usability test findings showed that:
- Users were dissatisfied because they had to rely on various systems to complete module and assessment-based tasks.
- Different modules used different systems.
- Systems required a learning curve on how to use them. One user summarised this notion by saying “It’s okay once you know how to use it.”
We also used the design sprint itself to gather some feedback from the users, all of whom echoed the findings from the survey and usability tests while presenting their own anecdotes. One participant recalled a time when he was unable to properly submit coursework via Turnitin because of a system error. This resulted in points being deducted from their grade. Other students highlighted their frustrations when accessing the systems via mobile devices.
Top tasks
To help focus the attendees on the best possible solution to the problem, we asked them to put forward their top tasks when accessing all the systems they use. There were 12 top tasks, which are listed by priority (Highest to lowest) below. The numbers indicate how many students completed those tasks.
- See course content (12)
- Submit coursework (12)
- Check grades (12)
- Find timetable and location of classes (10)
- Signing up for tutorials (10)
- Access reading lists (10)
- See deadlines (7)
- Access past papers (6)
- See personal info (6)
- Access recorded lectures (6)
- See university events (3)
Crazy 8s
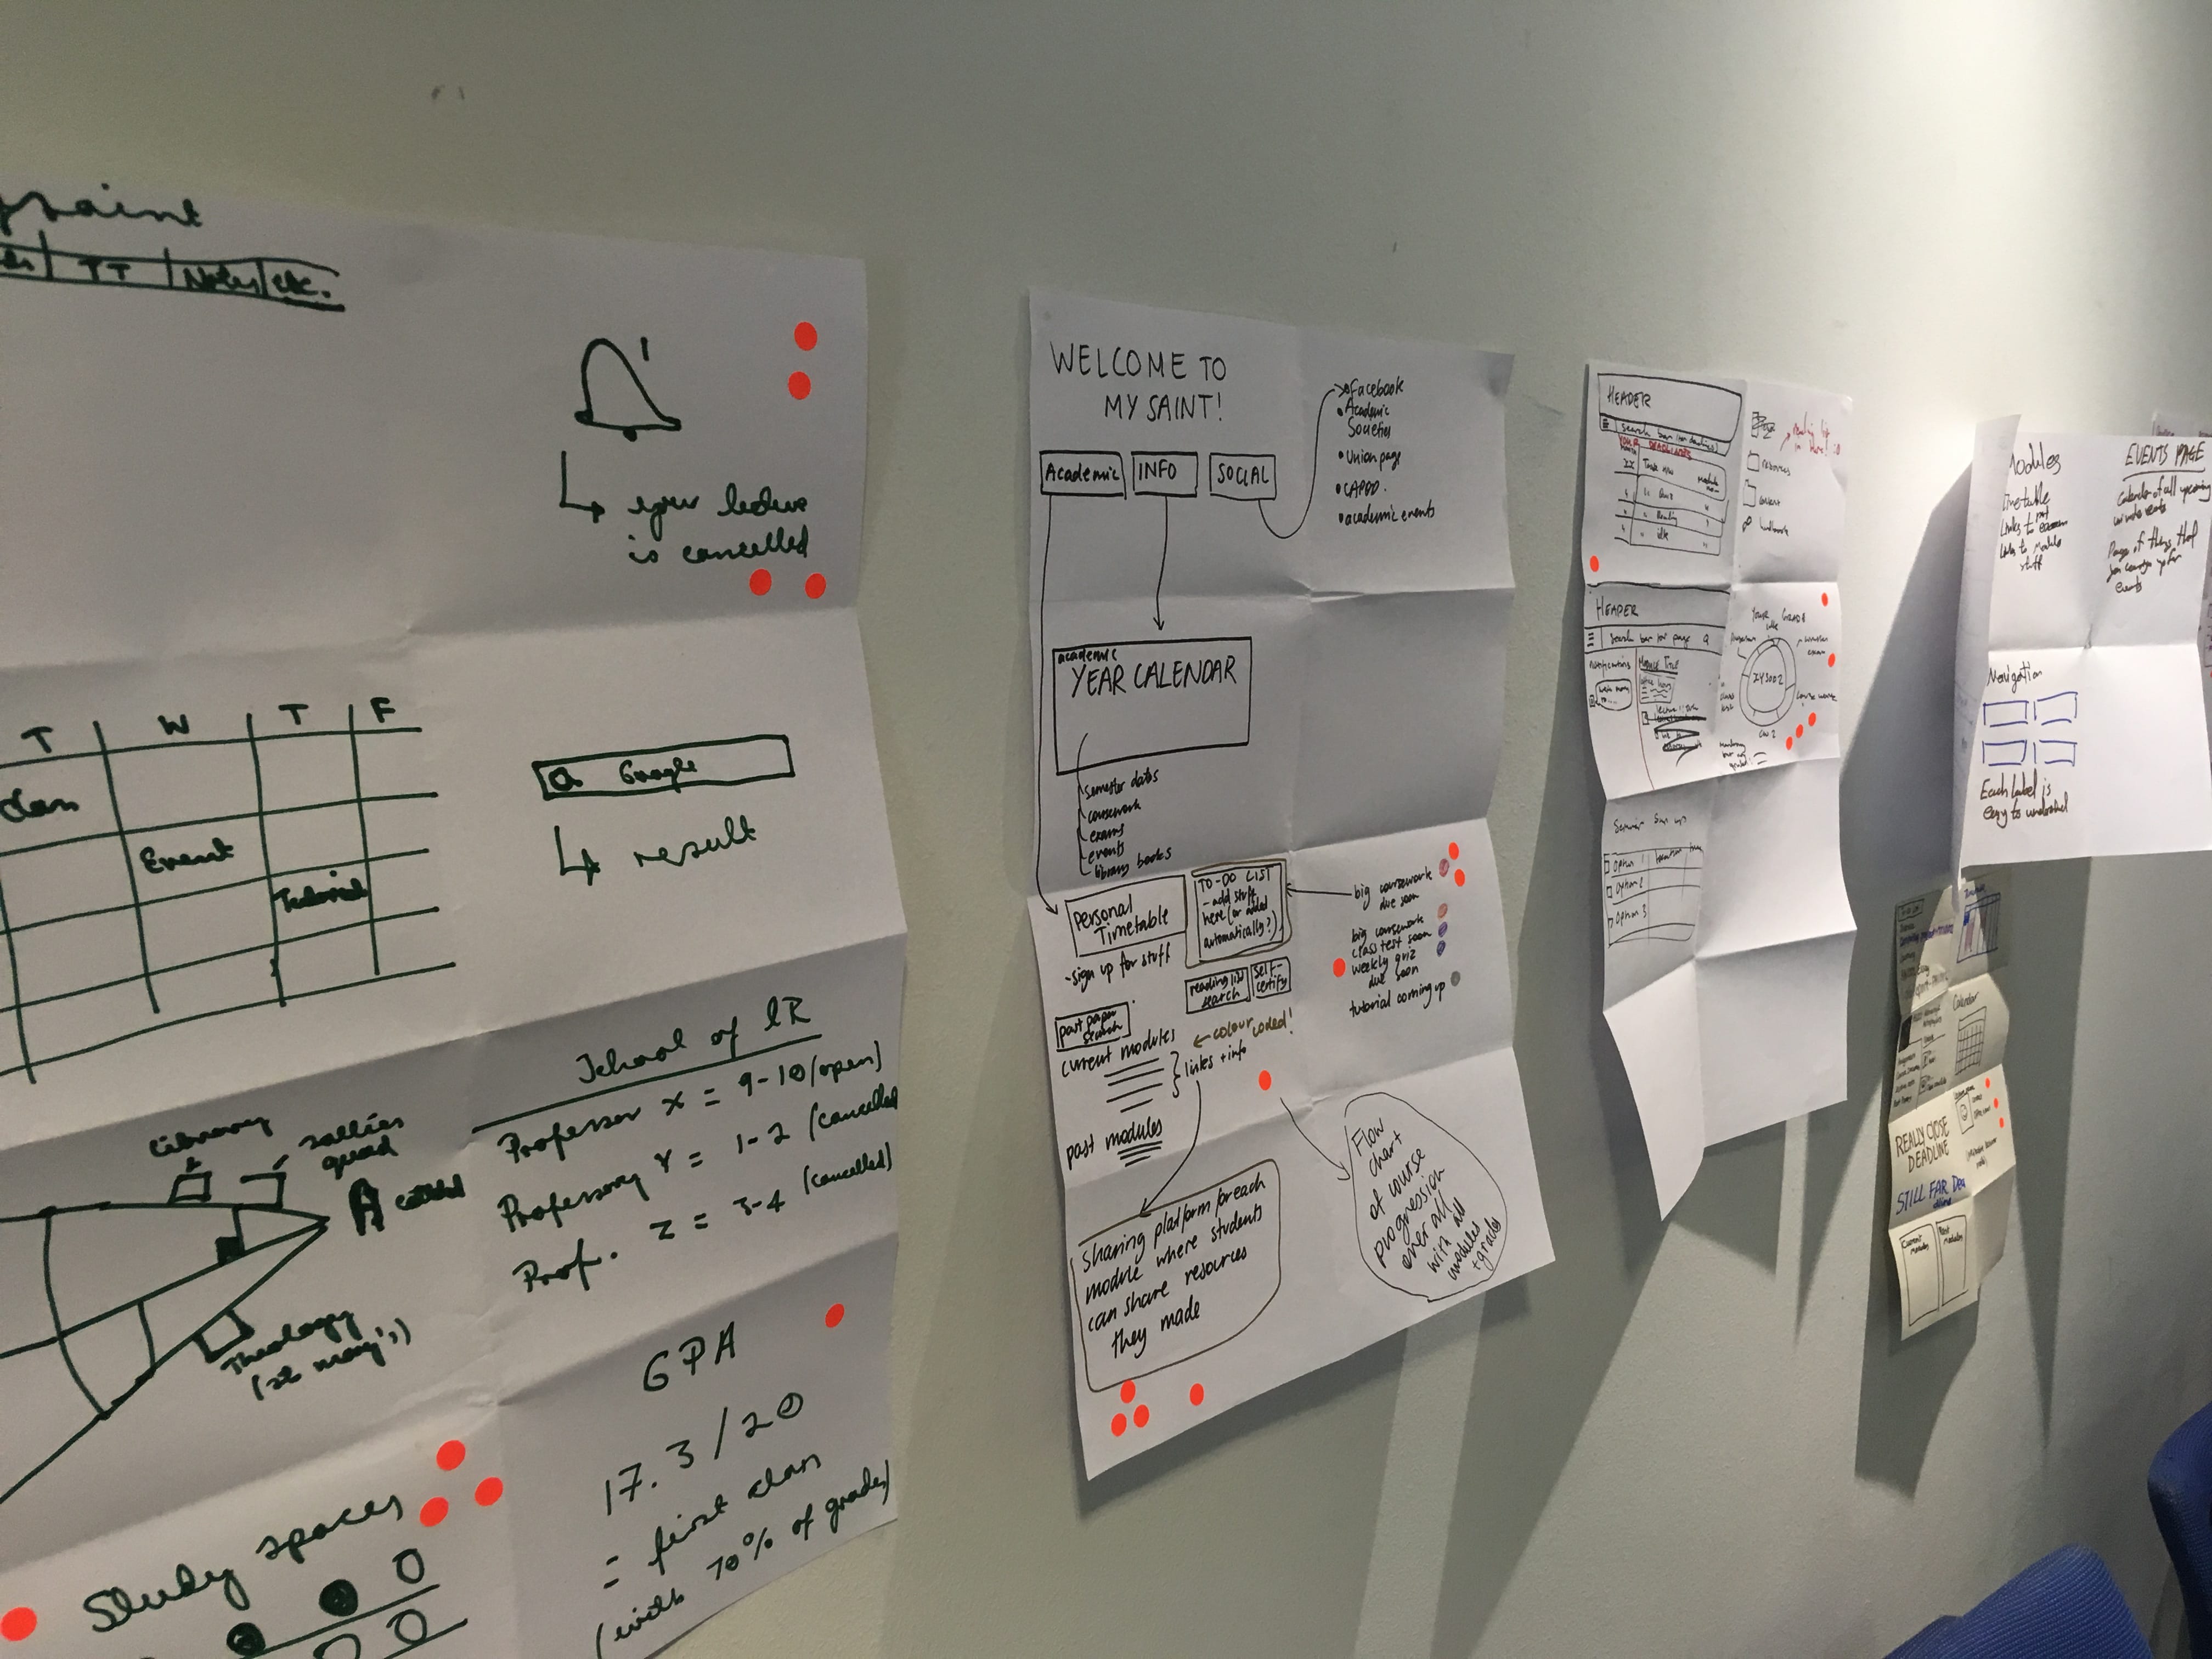
Participants then had eight minutes to sketch eight different ideas which could help solve the problem. We encouraged all shapes and sizes of ideas by showing them some previous examples. These examples showed both specific page layouts and abstract symbols or images – it doesn’t really matter what is drawn, or how it’s drawn (we know you’re not all artists!) it’s more about getting the idea across.
After participants presented their ideas they voted on their favourite ones. The most popular features were:
- Integrated email
- Quick links to student-specific services
- Staff profiles
- Notifications
- Visualisation of the grading system in a particular module
- Information about study spaces
- Up-to-date information
- Gamification of grades
- Grade calculator
- Student forum.
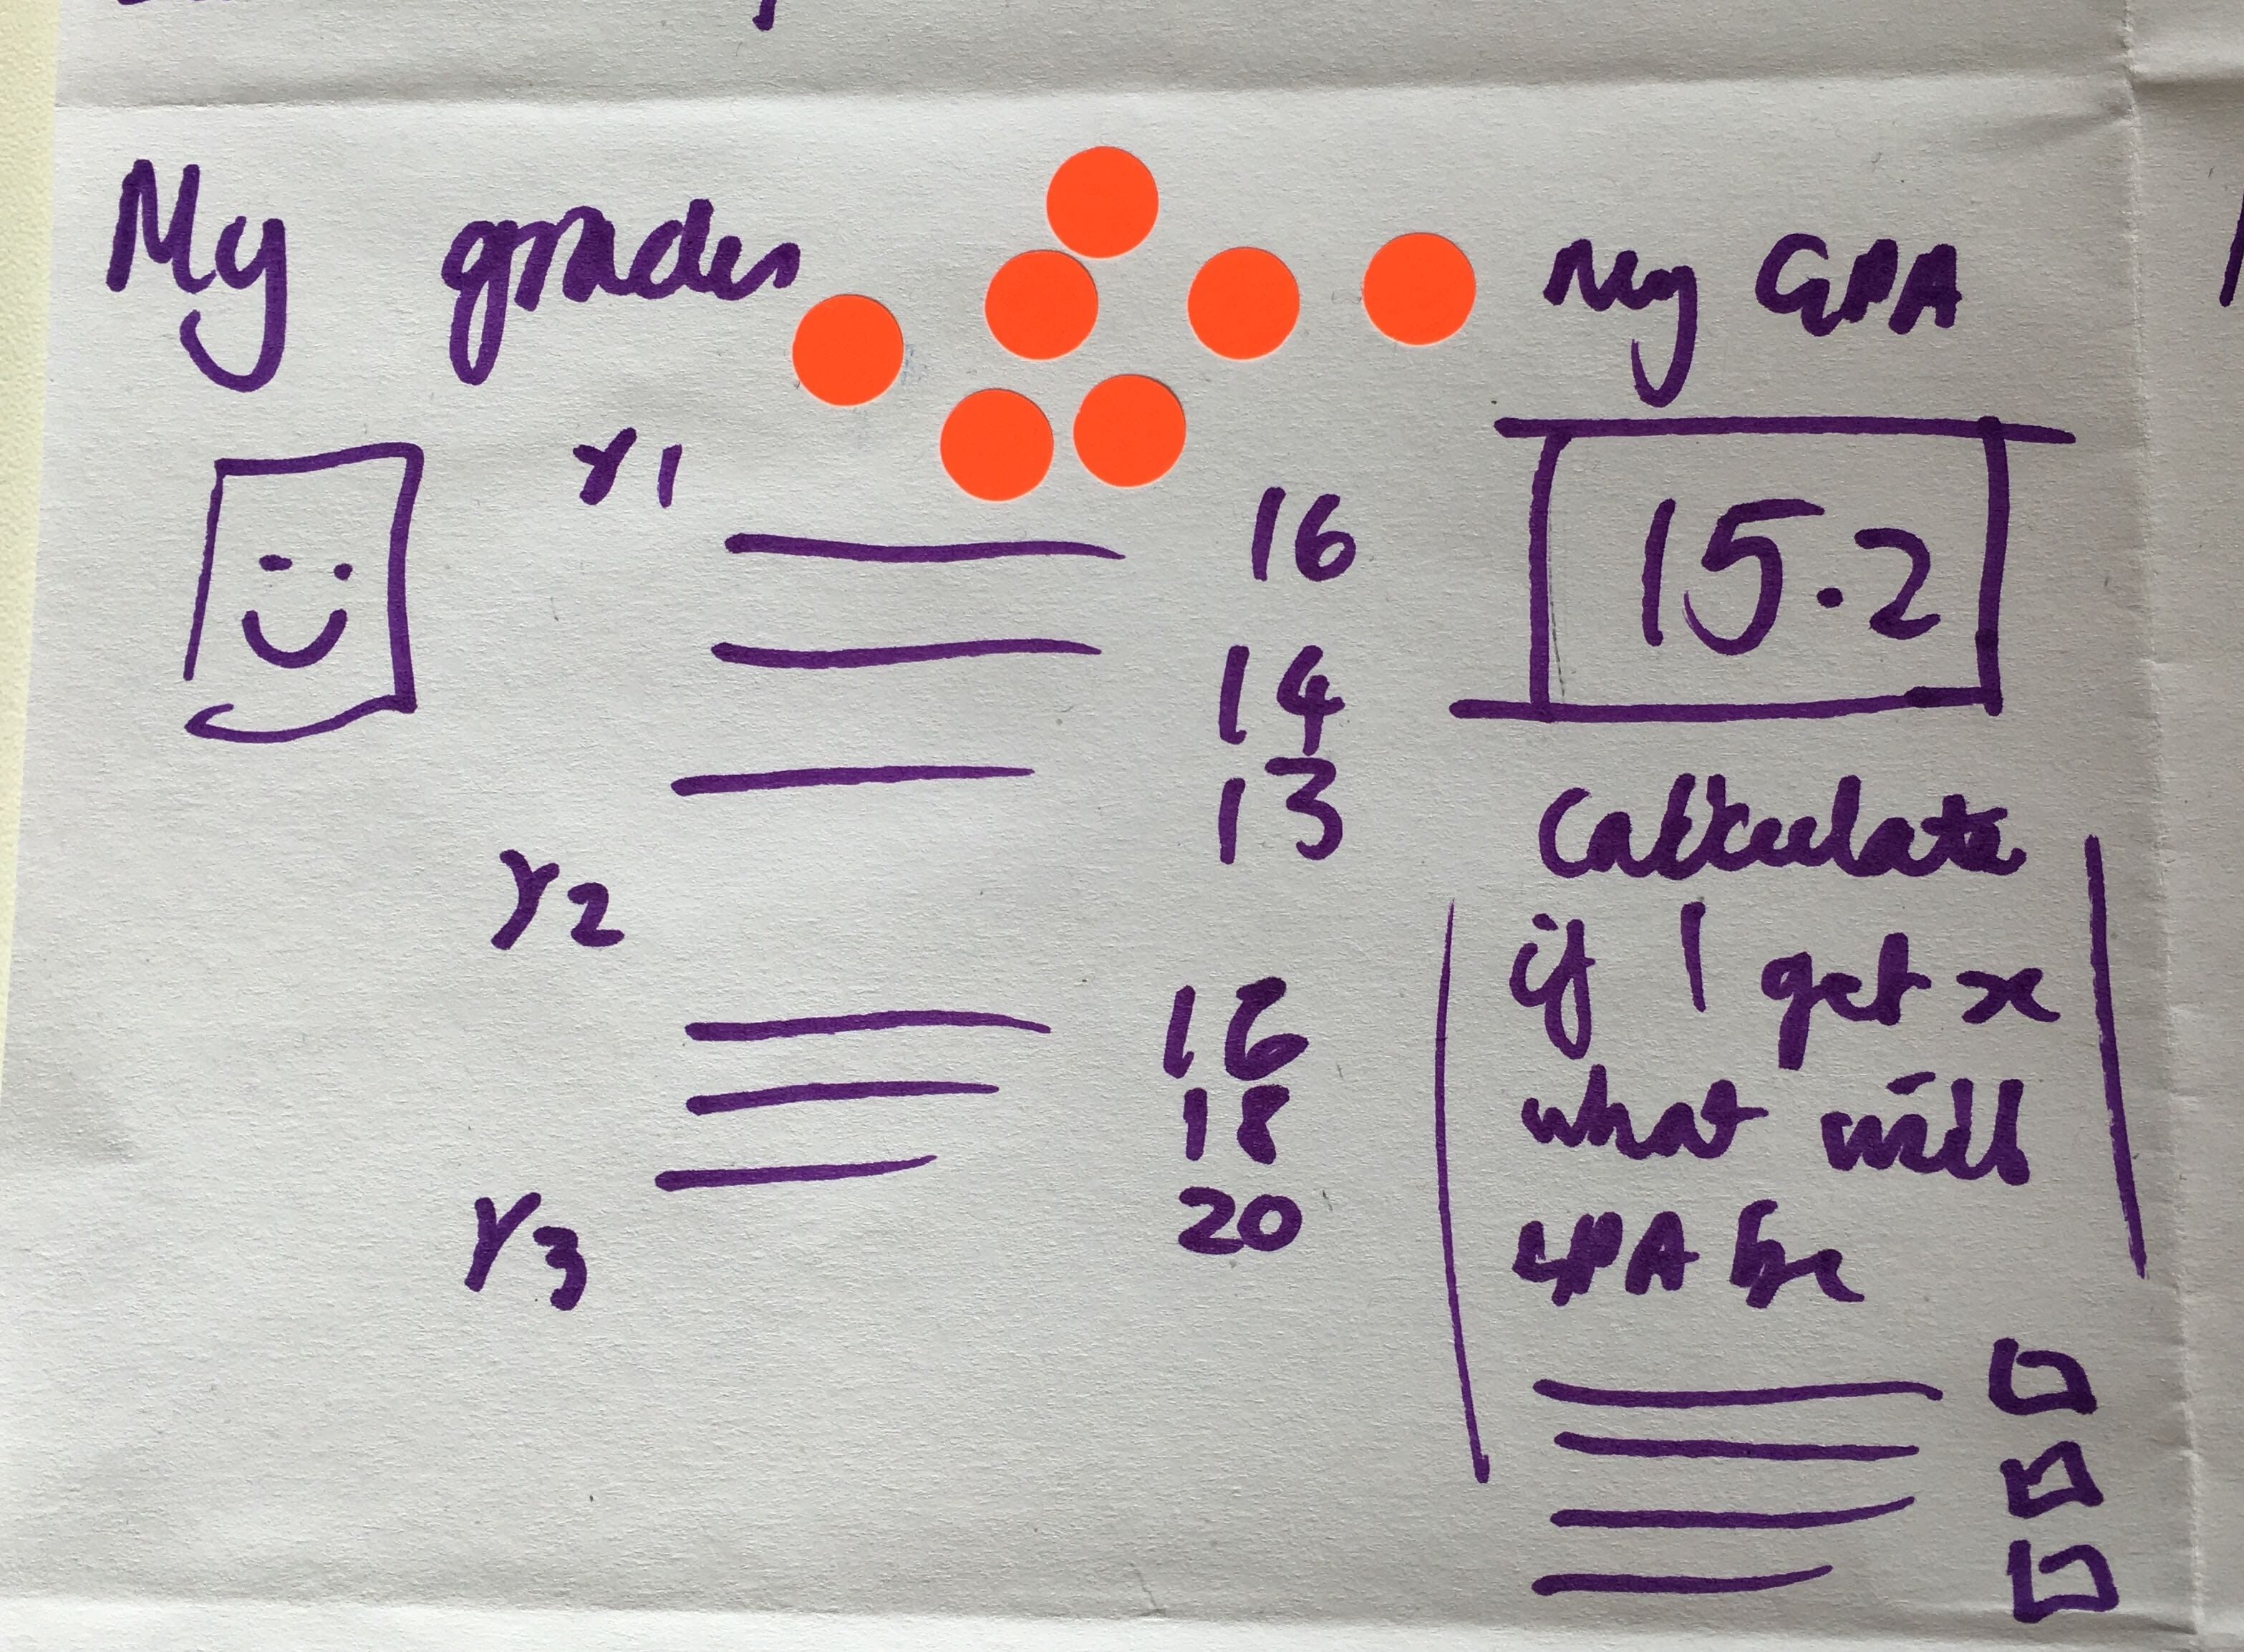
Ideas which focused on grade presentation were very popular, as students recalled how complex it is to see at-a-glance what your current over grade is, or even what individual grades for modules are. The solutions participants came up with sought to gamify the information and add extra features to improve their experience, such as an inbuilt degree calculator. Currently students need to rely on third party apps such as unofficial degree calculators to figure out what their overall degree class is.
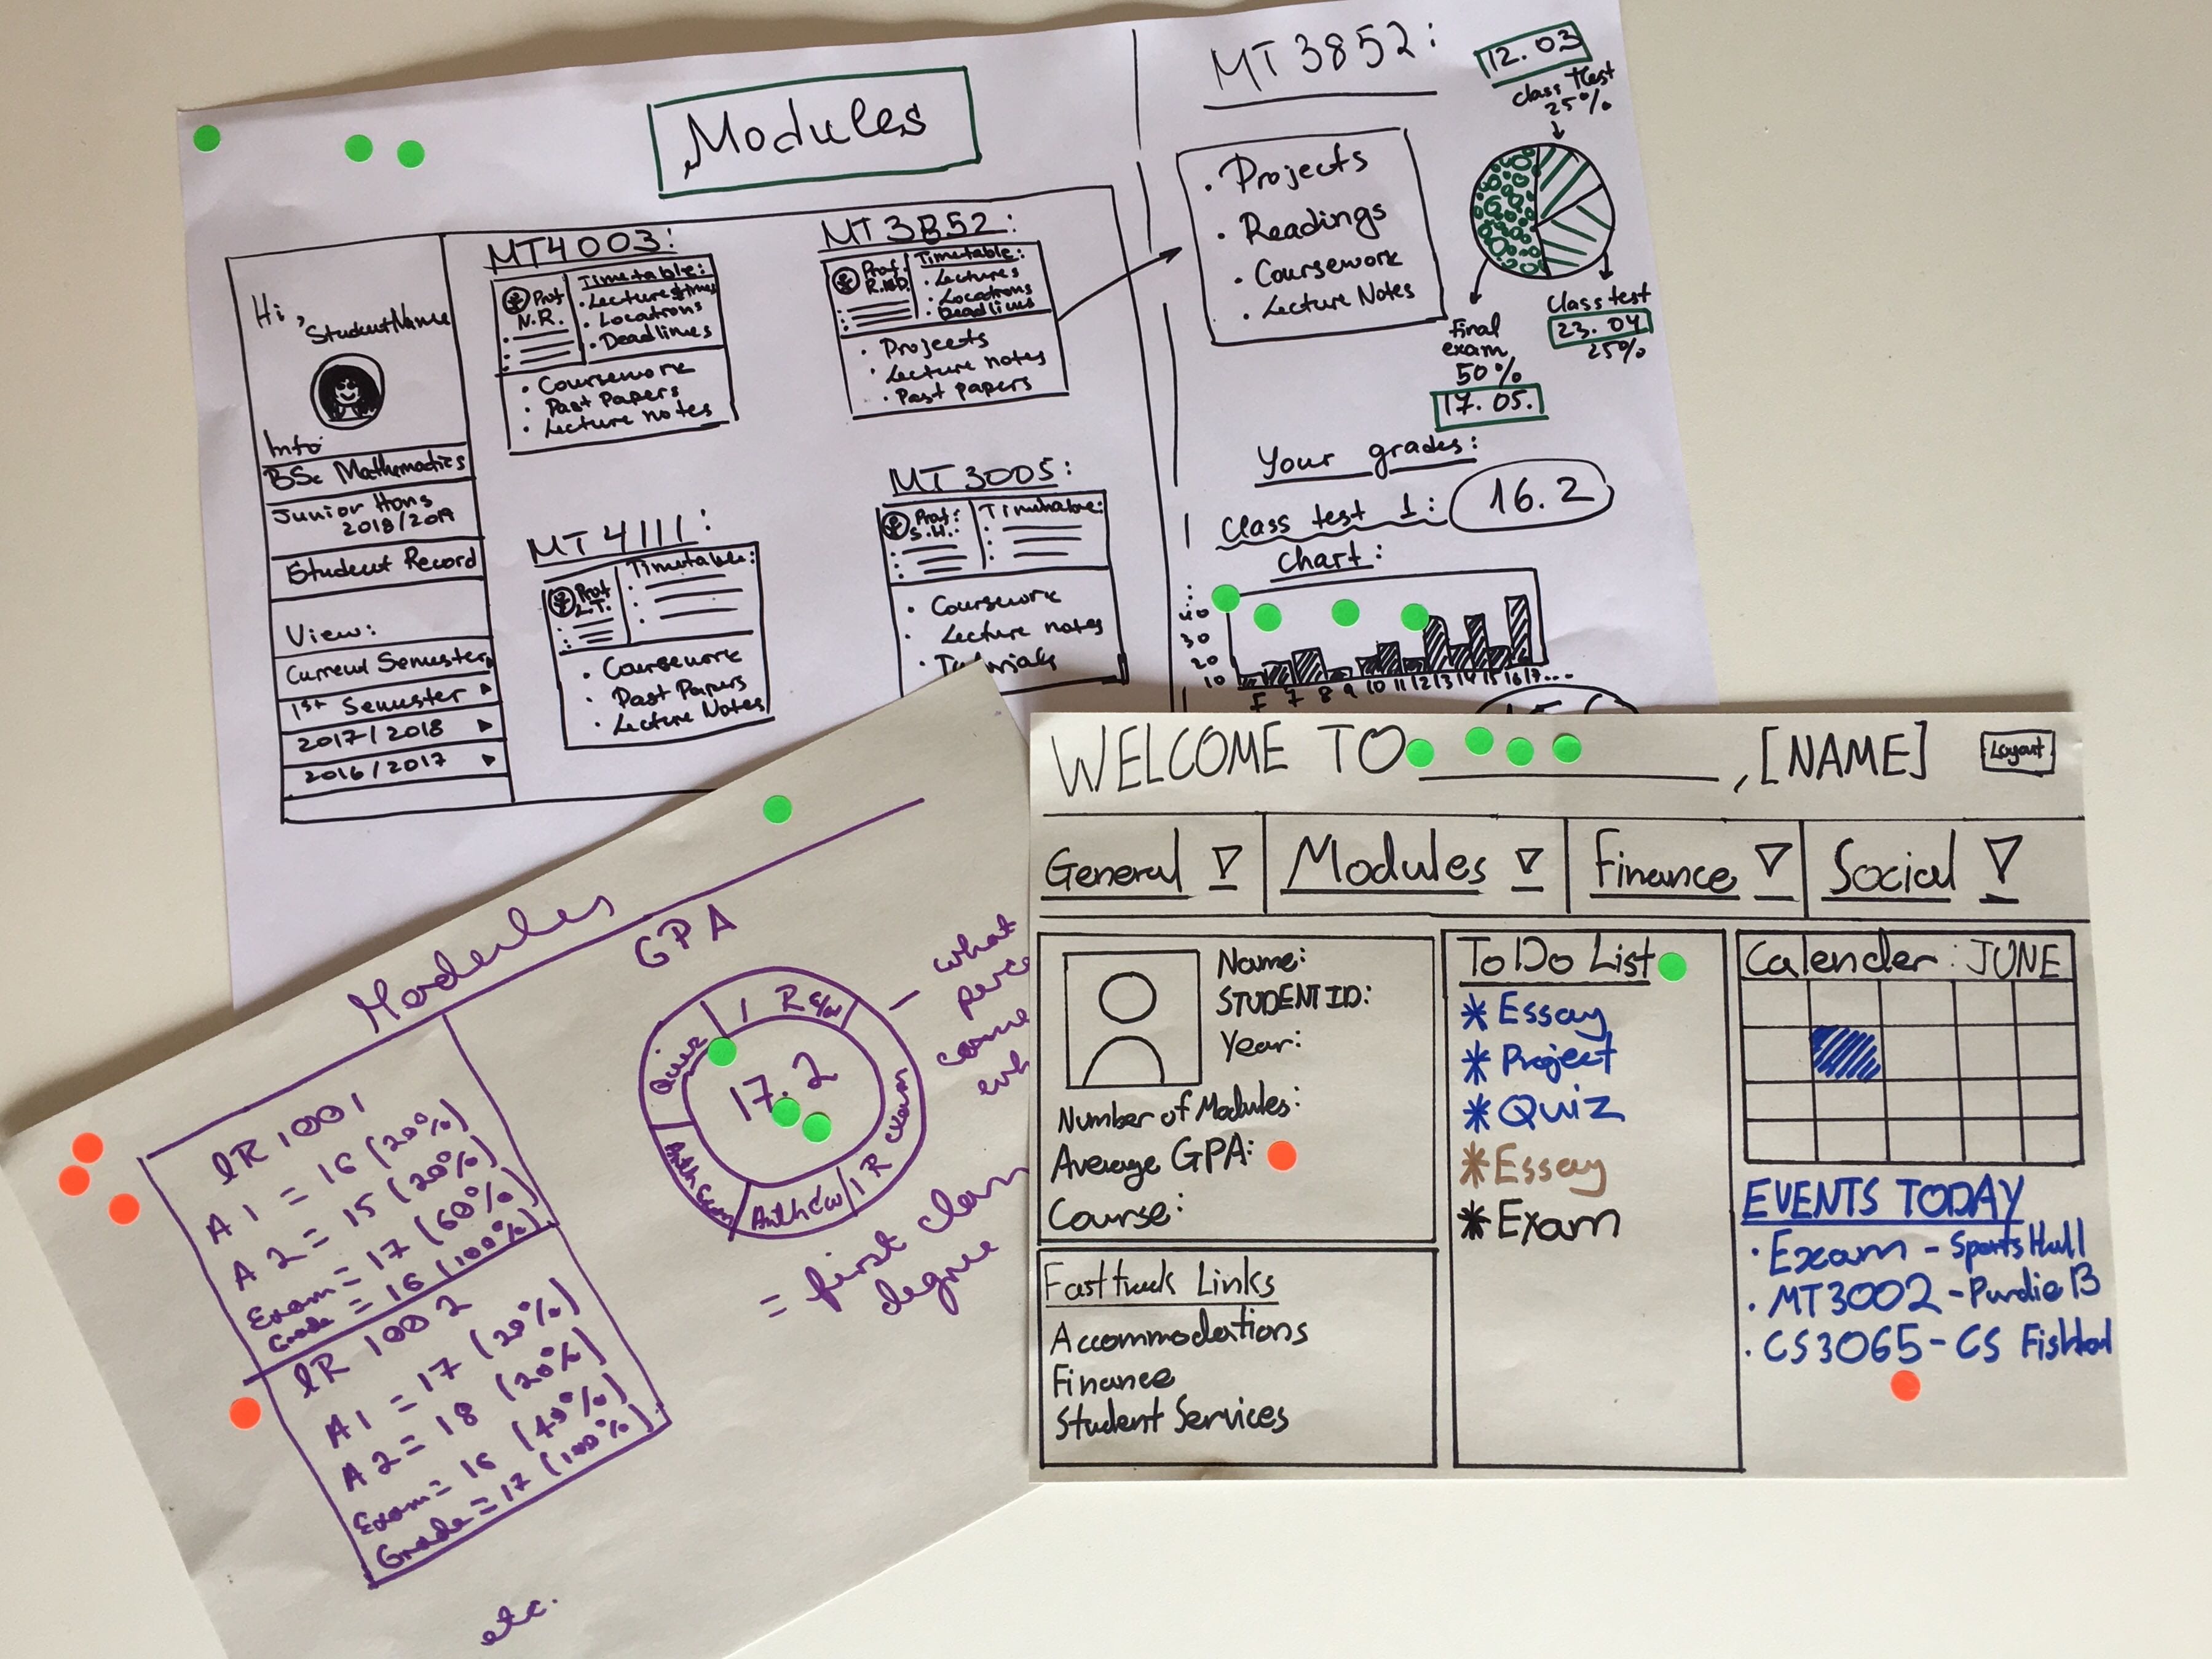
Solution designs
The solution designs were an opportunity for participants to flesh out some of their favourite elements from the crazy 8’s exercise. In the designs it was clear to see that participants wanted to improve the way module information was presented, but they also included additional features such as integrated calendars and email.
Once again, students were asked to talk through their designs and then vote across all designs on the features which they liked the most. The most popular designs included:
- integrated calendar systems that included deadlines
- a search bar
- personalised quick links
- graphs showing how their grades compared with peers on the same course
- module management and visualisation options, with a focus on all modules being in the same place
- at-a-glance grade presentation
- system personalisation
- resource sharing such as a forum
- email integration.
Despite facing a complex problem, we felt that the design sprint was a success. It was evident that there are some areas that students see as absolutely necessary to focus on, such as modules and grade information. What’s more, some of the ideas students came up with already exist in some shape or form across the systems they currently use, so now it’s just a case of figuring a way out to streamline the information architecture and integrate these features.
The next step in this process is for our designer, Lewis Wake to produce a wireframe design that will be a basic visualisation of the key findings. From there, colleagues from around the University will work together to figure out what is technically feasible.
We’re hoping to run a design sprint on the same topic around April or May for members of staff at the University. If you’d be interested in taking part, please get in touch with the digital communications team ([email protected]).