Google Analytics data for School websites
One of my first tasks for the digital communications team was to find out how School websites are used by external users over the course of one calendar year (2015) using Google Analytics. The data provided an invaluable insight to how external users interact with the School pages. I looked specifically at which pages on School websites are most popular, and I compared School websites to one another to see which sites would best respond to a redesign.
It is important to note that at the time of the study the digital communications team did not have access to all School websites in Google Analytics, which meant there was no data to analyse for the following Schools:
- Computer Science
- Film Studies
- History
- Medicine
- Philosophy
- Physics and Astronomy
- Social Anthropology
The first step was gathering the data. I needed to find out the following:
- The top ten most popular School pages for external users, including pageviews, unique pageviews and bounce rate
- Top ten most viewed pages for each School website, including all relevant data
- The top five sources of traffic for each School
- The percentage of traffic from mobile and tablet devices for each School.
Pageviews
15% of pageviews for the entire University website came from School websites. Of the total 21,063,114 pageviews received in 2015, Schools amassed 3,070,052 (14.57%) of that total.
The most popular School website (according to pageviews) was International Relations, whose pageviews (404,951) in 2015 were nearly double the overall average for all Schools (210,447). This supports our knowledge that International Relations is a very popular subject at St Andrews and many academics in International Relations are well known and often searched for.
Excluding the Schools’ homepages, the most popular pages across all Schools were pages which detail staff information, such as contact details and staff biographies. Out of the 14 Schools sampled, 71% of the Schools showed staff information to be the most popular. Below is a table which shows what pages were the most visited for each School.
| School | Page | Pageviews | Unique pageviews | Avg. Time on page (mins) | Bounce rate |
|---|---|---|---|---|---|
| International Relations | People | 35,178 | 13,601 | 00:29 | 26% |
| Management | Programmes | 29,664 | 21,361 | 00:25 | 17% |
| English | People | 26,703 | 6,525 | 00:16 | 24% |
| English Language Teaching | Programmes | 23,924 | 18,499 | 02:16 | 69% |
| Chemistry | People | 23,400 | 10,557 | 01:36 | 66% |
| Divinity | People | 20,159 | 12,492 | 01:35 | 55% |
| Psychology | Prospective Students | 16,288 | 12,470 | 00:17 | 25% |
| Mathematics | People | 12,372 | 7,860 | 00:42 | 39% |
| Geography and Sustainable Development | Postgraduate course | 10,492 | 7,368 | 01:20 | 49% |
| Art History | People | 9,031 | 4,287 | 00:34 | 27% |
| Modern Languages | People | 7,497 | 3,372 | 00:42 | 42% |
| Classics | People | 6,825 | 5,126 | 01:26 | 46% |
| Economics | People | 6,580 | 3,068 | 01:17 | 50% |
| Biology | Undergraduate Students | 3,033 | 2,157 | 01:24 | 73% |
| Geography and Geosciences* | Location | 1,040 | 907 | 02:34 | 70% |
*A note on Geography and Geosciences
In the above table, Geography and Geosciences and Geography and Sustainable Development are split to show the differences in the data between the two and in relation to the other Schools. However, there is another department from within Geography and Geosciences, Earth Sciences, which we do not currently have any data for due to the absence of the Google Analytics code on their site.
Whilst creating this report, it became clear that the complexities and difficulties of multiple departments with differently designed and separate sites, makes it extremely problematic when trying understand user experience and behaviour. Ensuring consistent design and site structure going forwards will make measuring such data easier and render the data more accurate and constructive.
Time
The table below shows the average times users spent on School websites. The highest average time spent on one school was 1 minute 25 seconds on Divinity and ELT. This is 30% higher than the average for schools.
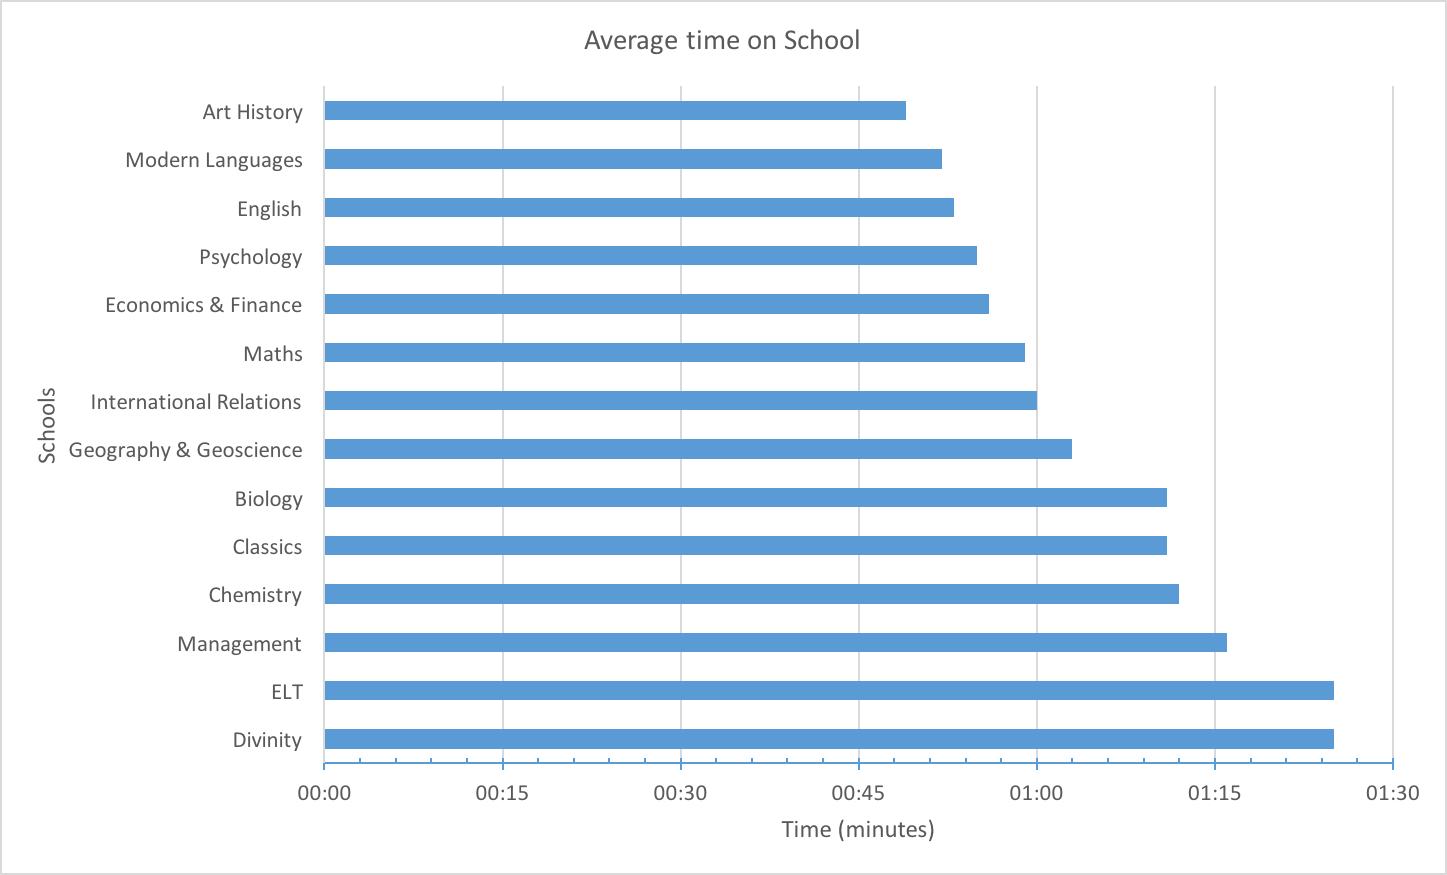
Whilst 1 minute and 5 seconds is not an extremely long amount of time to spend on a school website, the design and content on the ELT and Divinity pages could be improved in order to reduce this time to make it more align with the average. For example, for ELT, their site is generally difficult to navigate, and information is not easy to find. Some factors which contribute to this are:
- The majority of information is contained in sidebar menu
- Focus of sidebar is on students applying, rather than course information
- Frequent use of jargon and acronyms
- Key information, such as costs and lengths of courses, are buried.
Traffic from mobile and tablet devices
On average, just under a quarter of all traffic (21%) for School websites was from mobile and tablet users. We also found that over the last three years, the overall percentage of pageviews the University’s website received from mobiles and tablets has increased and will likely increase further in coming years.
Looking back to 2013, the percentage of traffic coming from mobile and tablets was 15%. This rose in 2014 to 20% and then rose again in 2015 to 23%. So far in in 2016 this is at 23%, but it is likely to rise year on year with the increasing use of mobile devices.
Sources of traffic
For all Schools, there was a combination of organic, direct and referral traffic.
- ‘Organic’ relates to traffic in which visitors were referred to a School’s page by an unpaid search engine listing, e.g. a Google.com search.
- ‘Direct’ details traffic from visitors who visited the site by typing the URL directly into their browser or who clicked on links from their bookmarks/favorites, untagged links within emails and documents.
- ‘Referral’ shows the traffic generated by visitors referred by links on other websites.
Organic search via Google was the most popular source of traffic for all schools. Second to this, again for all Schools, was direct traffic. After direct traffic, further organic traffic via Bing and Yahoo were generally the 3rd and 4th overall source of traffic for schools.
For 5 out of the 14 schools, referrals from social media were either the 4th or 5th most popular source of traffic. Referrals from social media and other external sources highlight to us the significance these sources play in terms of directing users to the site. Due to most users accessing social media via mobile or tablet devices, this highlights the need for responsive website design for Schools to make user experience more streamlined.
Conclusion
The results from this data analysis have provided the digital communications team with a benchmark for the School websites. Conducting further and more frequent analytics reports in the future will allow us to see the direct impact many of the design and content changes we bring in. This information can then be used to shape usability testing sessions in order to align both the quantitative and qualitative data.