Graduation 2016: what the data tells us
Graduation 2016 marked the second year of the new version of the graduation webpages. Last September, Carley Hollis wrote about the impact of the newly designed webpages compared with the ‘old’ design in 2014. Now, after another year with the new pages, we thought we’d look at how they’ve faired and how external user behaviour has changed since 2015.
The data below refers to people outside the University network who accessed the graduation section of the website from 12 to 29 June 2016.
Pageviews
The total overall pageviews (the number of times overall all pages were accessed) for the graduation section of the site decreased by 9% compared with the same period in 2015.
This decrease in pageviews could be attributed to a number of reasons. As Carley pointed out in her post, the total number of people viewing the graduation website during the graduation period fluctuates a little each year. The drop could be due to the number of students graduating, the popularity of the high profile honorary graduates and current affairs (referendum anyone?).
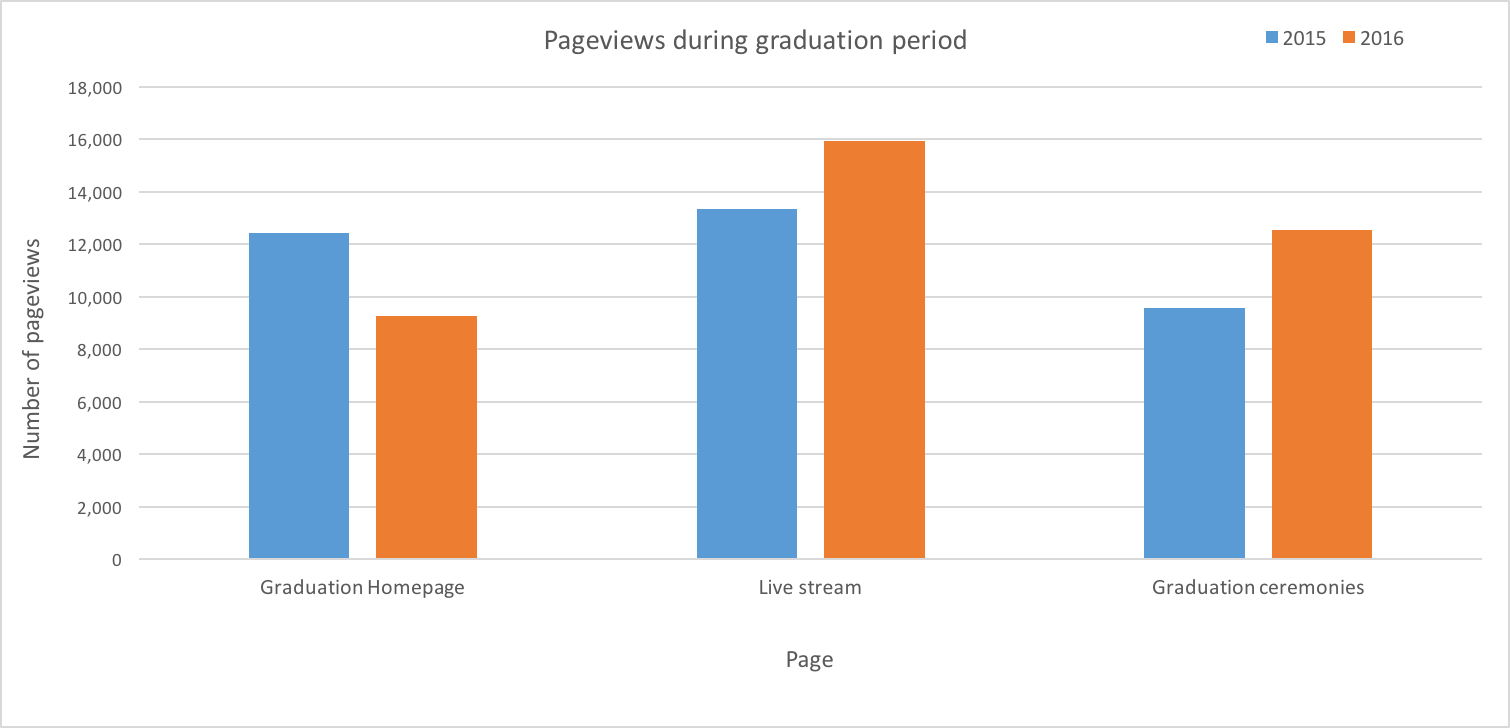
However, individual pages within the overall section had greatly increased pageviews. Notably, the pageviews for the graduation ceremonies section of the website increased by 30% from 9,577 views in 2015 to 12,436 views in 2016. Furthermore, the pageviews for the live stream page increased by 20% from 13,336 to 15,908.
Mobile and tablet pageviews
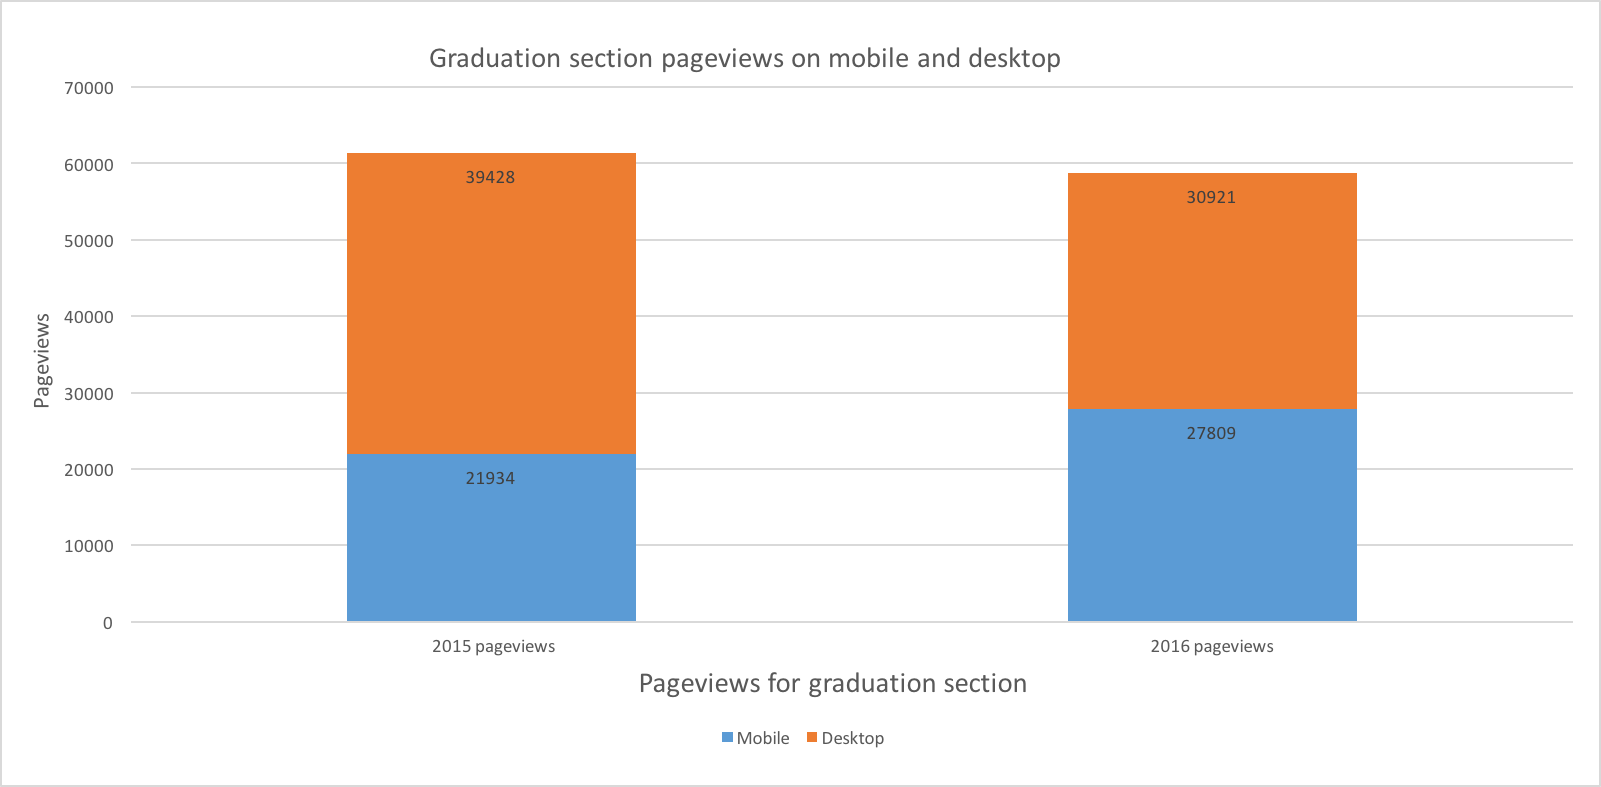
For the entire University of St Andrews website, pages viewed on mobile and tablet devices have been steadily increasing every year, and this trend is likely to continue. This trend was also evident with the graduation section of the website, which saw a 27% increase in mobile and tablet traffic compared with last year.
Mobile and tablet traffic made up 47% of the overall pageviews for the graduation pages (in 2015 it made up 35% of traffic). This increase aligns with the theory that the number of mobile users during graduation is high as many students don’t want to bring a laptop with them for the week.
This increase is also perhaps due to the optimisation of the graduation live stream for mobile devices for the first time, something we had recognised last year as a major drawback. This change was also reflected in the data, as pageviews from a mobile or tablet to the live stream page were up 113% from 3,851 in 2015 to 8,184 in 2016. For the live stream, mobile traffic accounted for 51% of the pageviews (in 2015 it accounted for 29% of traffic).
Traffic sources
During the graduation period, the main source of traffic to the graduation pages was organic search via Google and other search engines. This is also evident in Google Analytics, because organic search during the graduation period increased by 5% compared with last year.
A high number of sessions from organic search suggests that people are able to quickly find the information they need via Google. Having a responsive site with up-to-date and relevant information all help direct people to the University of St Andrews website.
Social media also played a major role in directing users to certain areas of the graduation section. This is likely why the graduation homepage received 25% fewer views than in 2015 as students, parents and alumni were directed straight to a particular page. For example, the live stream was the top landing page across the whole website for users from Facebook during the graduation period and was responsible for 3,200 pageviews to that page.
Bounce rate
The ‘bounce rate’ refers to an instance where the user visits a page, and then leaves the site from the same page.
In 2015, the bounce rate was at 37% for the graduation webpages. This has increased by 29% in 2016 to 48%. Despite the rise, this is still a good figure in terms of bounce rate, as a high bounce rate is generally seen as greater than 75%. From the breakdown of the pageviews listed above, the bounce rate could have increased due to the nature in which people were accessing the webpages in the direct format.
Conclusions
While the overall pageviews for the graduation section have decreased, certain pages within that section have increased significantly. This tells us that the live stream, which was heavily pushed through social media, directed many students specifically to that page more effectively than in the past.
Overall, the use of social media in general during graduation has had a positive effect on pageviews to certain pages of the graduation area. In future years, increasing social media use in a tailored fashion could help boost figures even more.
Ensuring the live stream was accessible via mobile and tablet devices has greatly affected the pageviews for the page. This confirms to us the importance of having a responsive design, and that users will interact with content that is responsive.