Degree conferral ceremonies summer 2020 analytics data
Between Monday 27 July 2020 and Friday 31 July 2020, nine degree conferral ceremony videos were premiered on the University website. This year we have been working in an extraordinary operating environment and we have had to innovate quickly to deliver the graduation experience in a new way while still sustaining prestige.
These streams were accessible via YouTube and were embedded on one page of the University website.
We also set up an alternative web page embedding each video hosted directly on University servers – primarily for users who have no access to YouTube, and for users encountering potential problems with the YouTube premieres.
After each ceremony had ended, each YouTube video’s privacy remained as ‘public’. The data in this blog post will only look at the engagement of these videos during the degree conferral week.
Number of graduating students
In total there were 1967 graduating students. This year was largely composed of students from the following countries:
USA, UK, China, Canada, Germany, France, Malaysia, Hong Kong, Italy, and India.
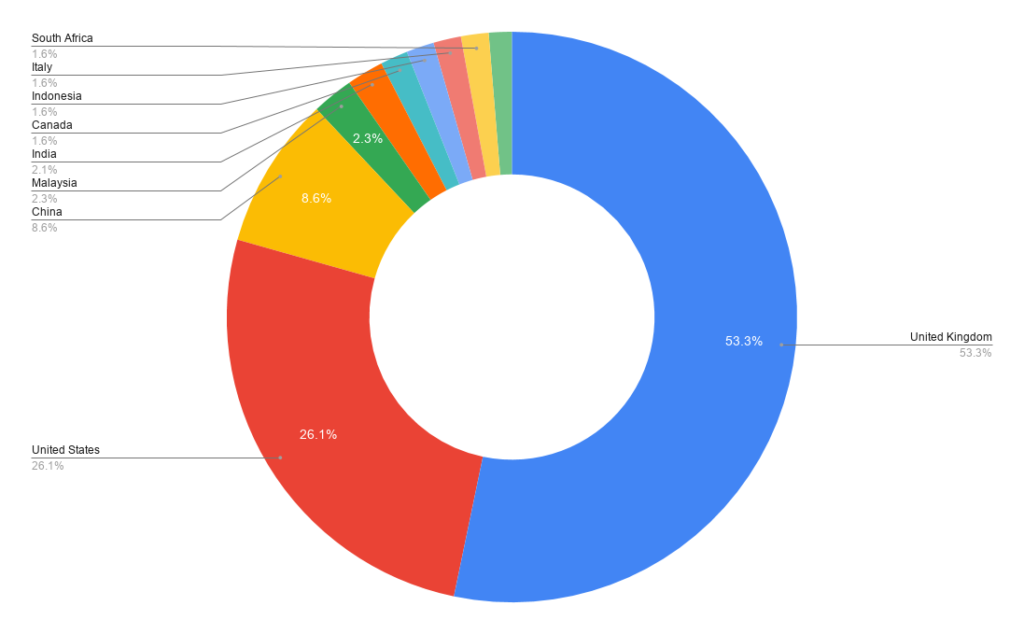
Page views of the ‘watch graduation live’ web page per country
The YouTube videos were embedded on the ‘watch graduation live‘ web page of the University website.
In total, the ‘watch graduation live’ web page had 5,401 unique page views over the five-day period.
The countries with the top ten unique page views are as follows:
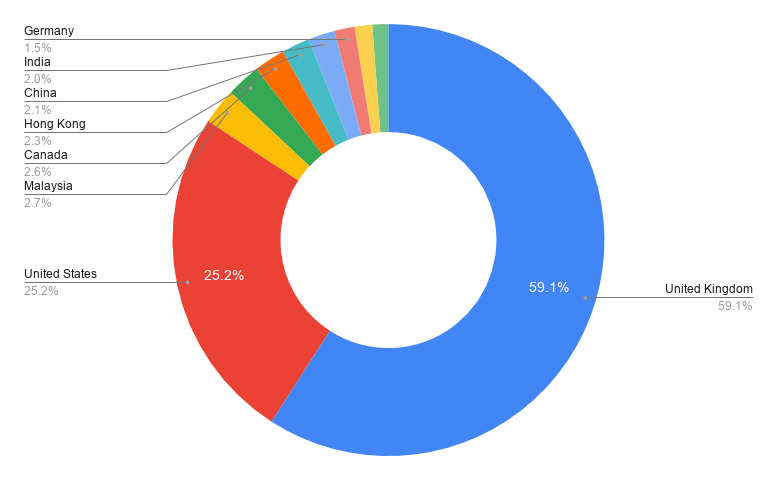
| Country | Unique page views |
|---|---|
| 🇬🇧 United Kingdom | 2,610 |
| 🇺🇸 United States | 1,112 |
| 🇲🇾 Malaysia | 119 |
| 🇨🇦 Canada | 113 |
| 🇭🇰 Hong Kong | 103 |
| 🇨🇳 China | 93 |
| 🇮🇳 India | 88 |
| 🇩🇪 Germany | 67 |
| 🇲🇽 Mexico | 58 |
| 🇫🇷 France | 53 |
YouTube views per degree conferral ceremony
View counts of the nine degree conferral ceremonies were somewhat evenly distributed. In total, the YouTube videos had 8,319 views.
The majority of views occurred during the first ceremony and then dropped significantly for subsequent ceremonies.
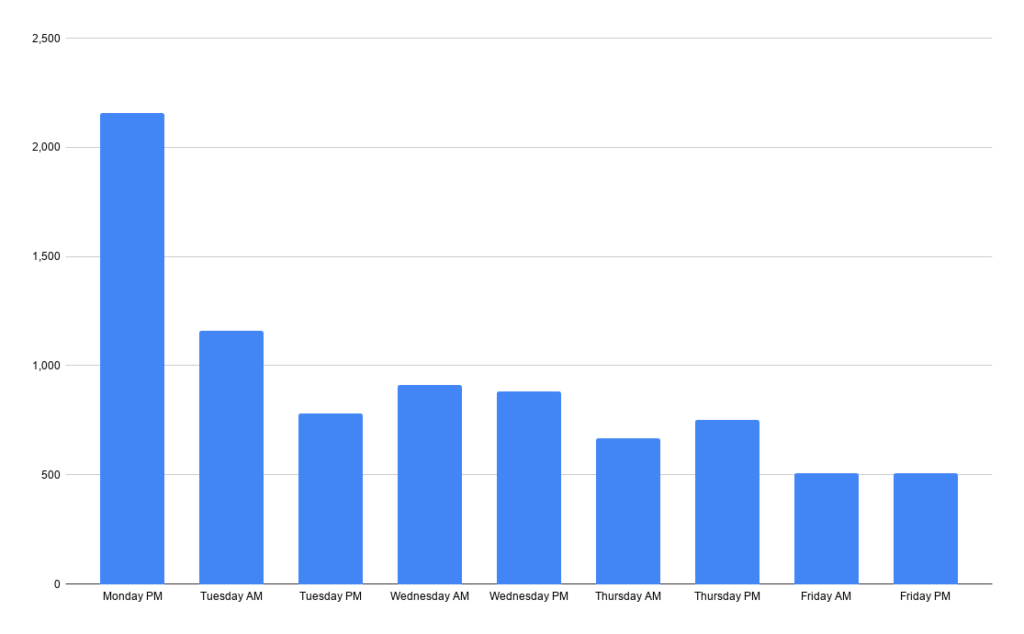
| Country | Views |
|---|---|
| Monday PM | 2,155 |
| Tuesday AM | 1,158 |
| Tuesday PM | 780 |
| Wednesday AM | 910 |
| Wednesday PM | 883 |
| Thursday AM | 665 |
| Thursday PM | 751 |
| Friday AM | 508 |
| Friday PM | 509 |
| Total | 8,319 |
YouTube views per country
From the YouTube data, we can determine which parts of the world viewers were in when watching the degree conferral videos.
In total, the videos were viewed in 24 countries.
The top ten countries the ceremonies were viewed in are as follows:
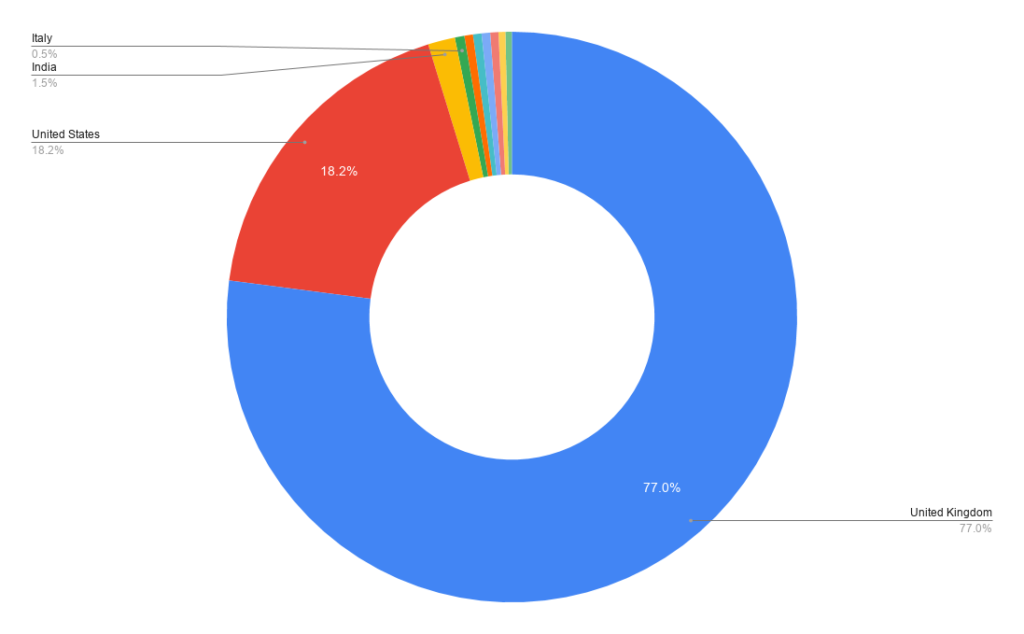
| Country | Total playbacks |
|---|---|
| 🇬🇧 United Kingdom | 3,978 |
| 🇺🇸 United States | 940 |
| 🇮🇳 India | 79 |
| 🇮🇹 Italy | 28 |
| 🇪🇸 Spain | 25 |
| 🇬🇭 Ghana | 25 |
| 🇲🇽 Mexico | 25 |
| 🇨🇦 Canada | 24 |
| 🇹🇷 Turkey | 20 |
| 🇭🇰 Hong Kong | 19 |
YouTube comments
There were 92 total comments posted on the nine YouTube videos with the majority posted on Thursday afternoon’s ceremony video reaching 27 comments.
Likes vs Dislikes
The nine videos were liked on YouTube 122 times with 6 dislikes.
That is a 95.3% like to dislike percentage.
Audience retention
16.2% of all viewers watched the ceremonies from start to finish without drop off.
That is 513 unique viewers.
This could suggest that over 80% of viewers were waiting to hear their own name before dropping off.
Traffic sources
The majority of views came from the University website. YouTube features including the channel page, search, and subscription feed made up over 25% of total traffic. Views from social media made up only 14% of all traffic.
The website is still the main sign post for the videos but it is interesting to see that our YouTube channel is becoming more reliable for users to engage with video content.
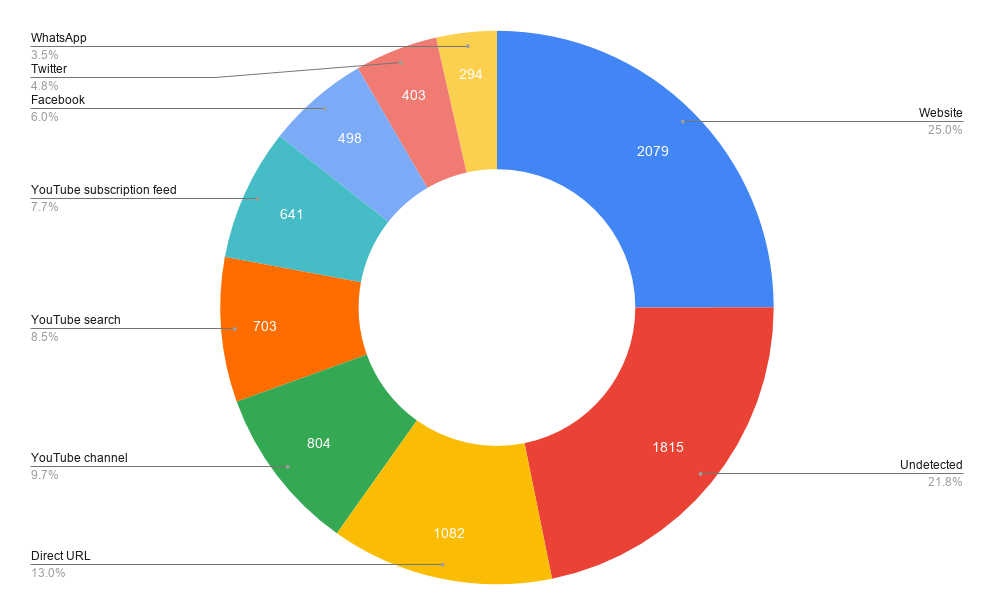
| Source | Viewers |
|---|---|
| Website | 2079 |
| Undetected | 1815 |
| Direct URL into browser | 1082 |
| YouTube channel page | 804 |
| YouTube search | 703 |
| YouTube subscription feed | 641 |
| 498 | |
| 403 | |
| 294 |
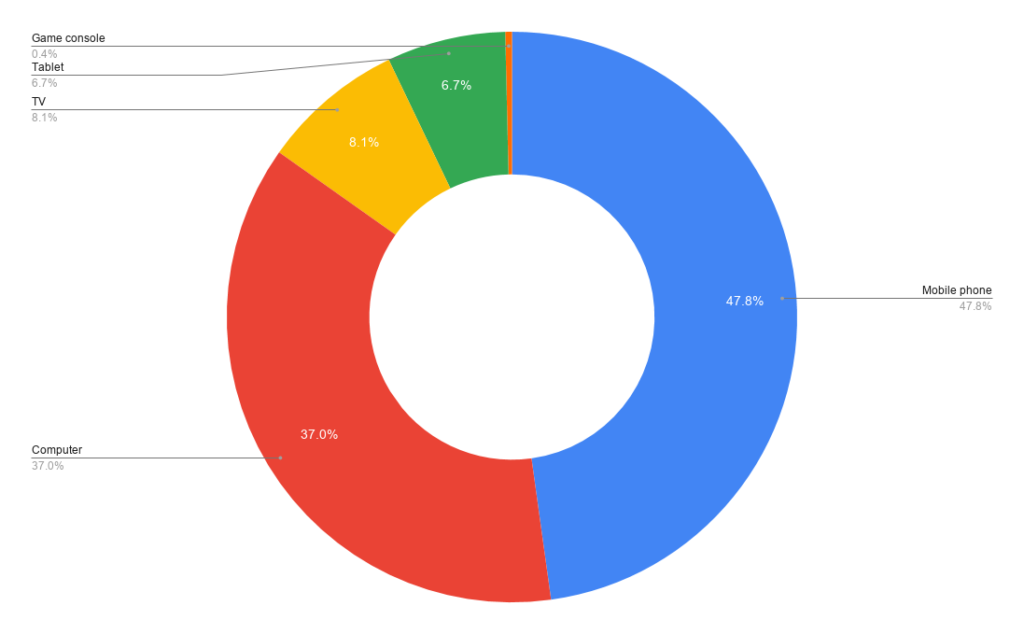
Devices used to view YouTube videos
Users were mainly viewing the YouTube videos on mobile phones. This is a difference from previous years where computers were the most popular device.
| Device type | Views |
|---|---|
| Mobile phone | 3,941 |
| Computer | 3,049 |
| TV | 667 |
| Tablet | 555 |
| Game console | 31 |
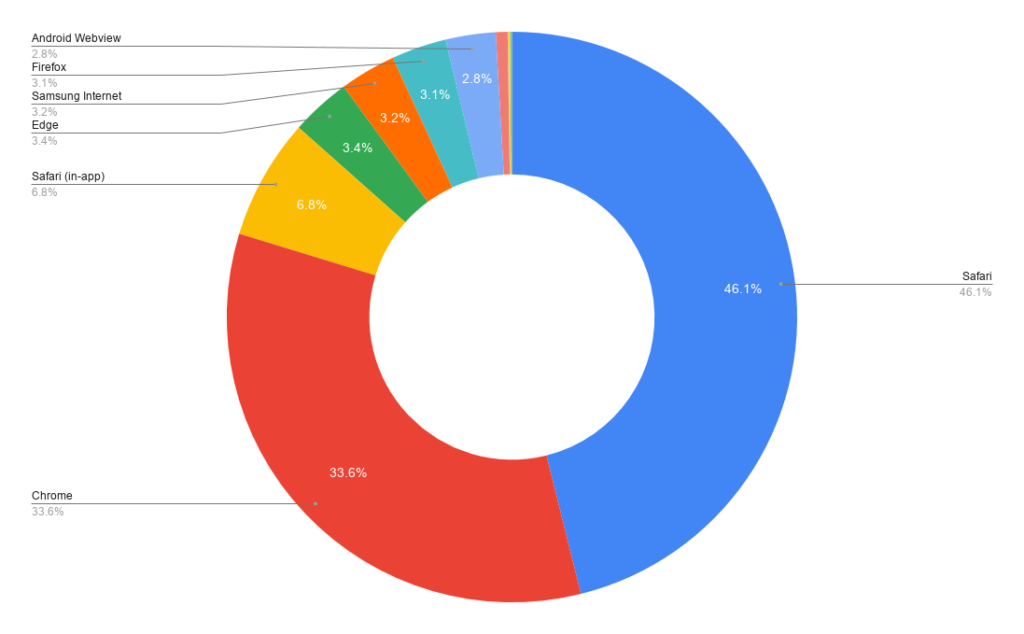
Browsers used to view the ‘watch graduation live’ web page
Safari was the most popular browser used to view the ‘watch graduation live’ web page.
| Browser | Unique page views |
|---|---|
| Safari | 2,487 |
| Chrome | 1,813 |
| Safari (in-app) | 369 |
| Edge | 183 |
| Samsung Internet | 172 |
| Firefox | 168 |
| Android Webview | 153 |
| Internet Explorer | 36 |
| Amazon Silk | 7 |
| Opera | 6 |
Page views for alternative ‘watch graduation live’ web page per country
An alternative page was used to allow users who had problems with the YouTube embedded stream to view the ceremonies through FlowPlayer.
In total, the alternative live stream web page had 443 unique page views over the five-day period.
The countries with the top ten page views of the alternative page are displayed in the below charts.
Users from China have restricted access to YouTube. There is a direct correlation between users based in China navigating from the ‘watch graduation live’ web page (93 page views), through to the alternative web page (33 page views). 60 users based in China either chose not to view the alternative stream, or were unsuccessful in locating the link. We could make this more prominent for future ceremonies.
| Country | Unique page views |
|---|---|
| 🇬🇧 United Kingdom | 204 |
| 🇺🇸 United States | 100 |
| 🇨🇳 China | 33 |
| 🇲🇾 Malaysia | 9 |
| 🇮🇳 India | 8 |
| 🇨🇦 Canada | 6 |
| 🇮🇩 Indonesia | 6 |
| 🇮🇹 Italy | 6 |
| 🇿🇦 South Africa | 6 |
| 🇨🇴 Colombia | 5 |
Conclusion
Compared to Summer 2019 graduation week, the web page views have decreased by half, but the total video views have increased by 1,000. This may mean that the YouTube channel is becoming more common knowledge for viewing our graduation ceremonies.
It is clear that offering an alternative to YouTube meets a requirement in some countries, however, we could find ways to make the alternative page more apparent as there is noticeable drop-off. We will continue to offer this service for future graduation ceremonies.