A look at T4 Dashboards
TerminalFour have recently released the dashboard module to the latest version of T4v8. But what is it and what affect will it have on its users? Images were taken from Gillian McAuliffe’s presentation at the T4 Virtual User Conference in October 2020 and the TerminalFour website.
What is the dashboard?
The new dashboard gives users an overview of what’s going on with your content, media and users within T4v8. It has been developed using programmable layouts and T4 themselves are encouraging people to develop extra features and widgets which can then be shared with other people. They could also be incorporated in a future T4 release!
The dashboard features five tabs: “Welcome”, “Content health”, “Recent content activity”, “User activity”, and “Digital asset usage”.
Welcome
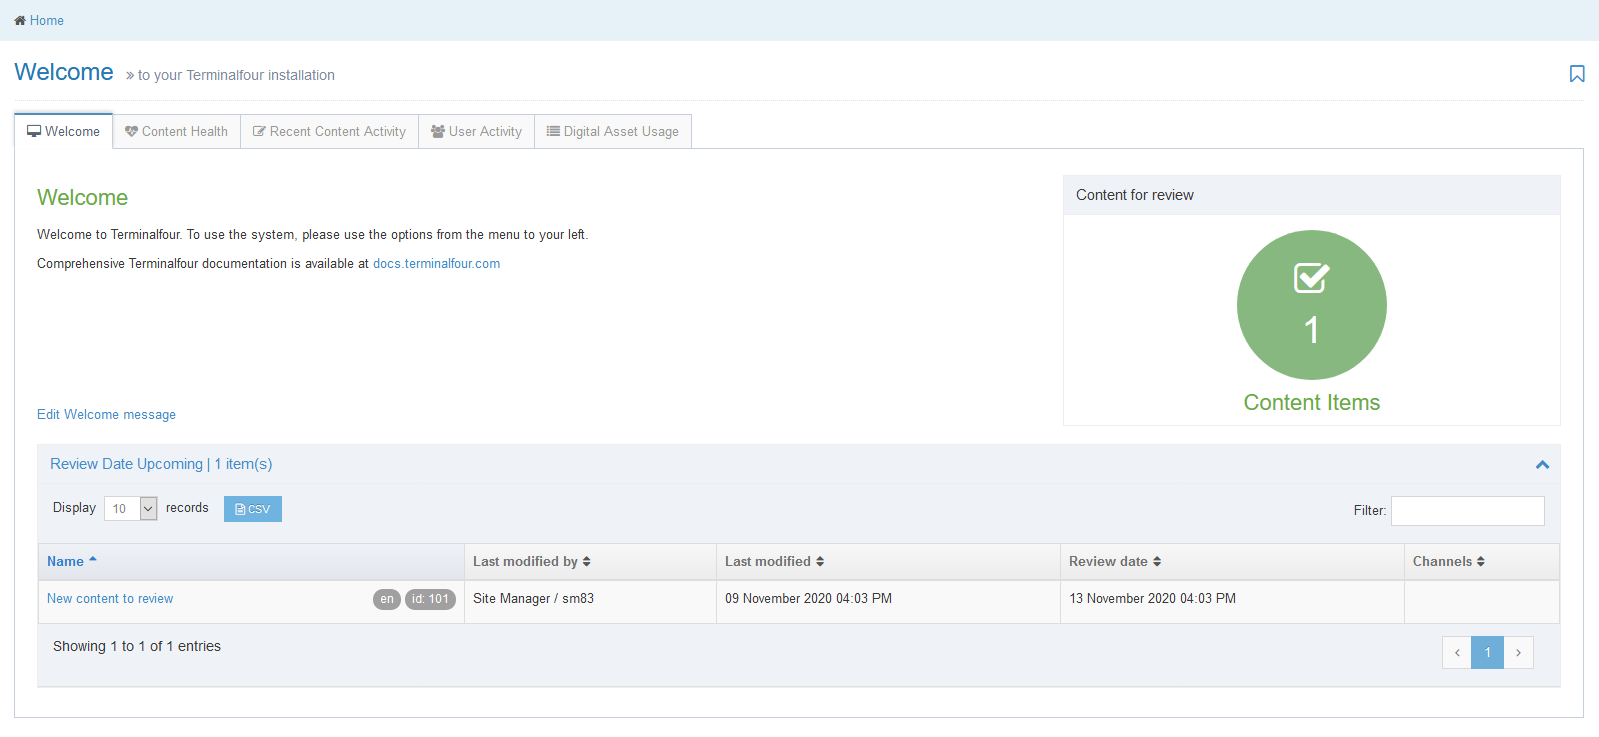
If set, this tab will be the first one that users see when they log in to T4 and shows a welcome message and what content is up for review. The big green circle on the right shows how many content items have their review date for the end of the week (Sunday). Underneath, it shows a bit more details about what specific content is approaching its review date. Content will only be shown in this section if its review date is within a week from today.
Content health
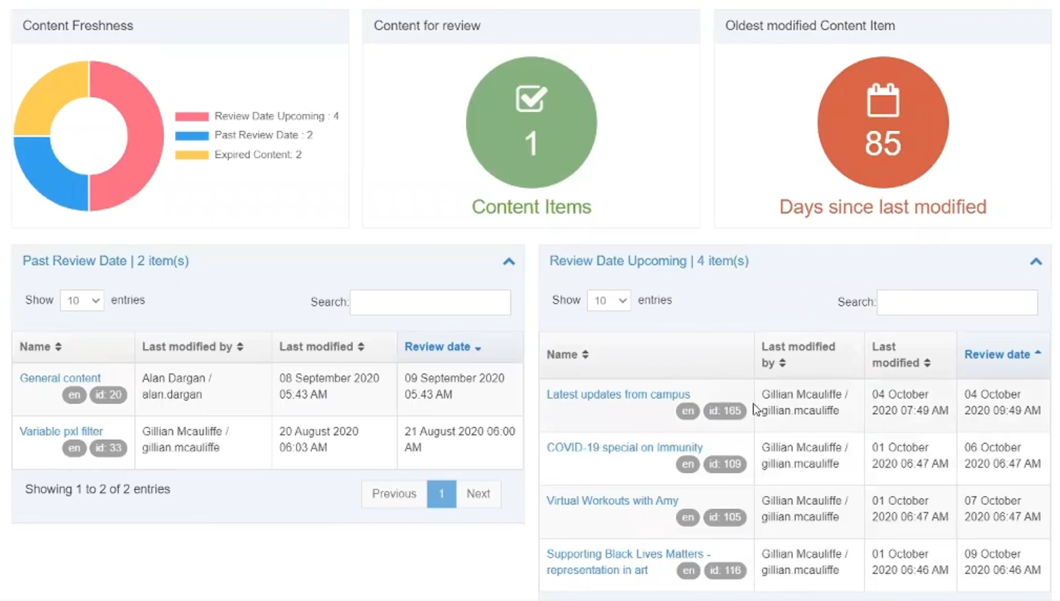
The content health tab shows how “fresh” the content is on the site – what’s coming up for review, what’s past the review date, and what content has expired – and shows some visuals depicting this at the top. The two visuals next to the content freshness pie chart show how many content items have their review date coming up (much like the visual on the Welcome tab), and how old the oldest modified content item is.
Below this, are four sections detailing the visuals above – they show what content is past its review date, what content has its review date upcoming, the content that has expired, and the oldest content since its last modified date.
Each user will only be able to see the data based on their user role and what sections they have access to. Moderators with access to one section of the site won’t be able to see the data about content from other sections of the site.
Recent content activity
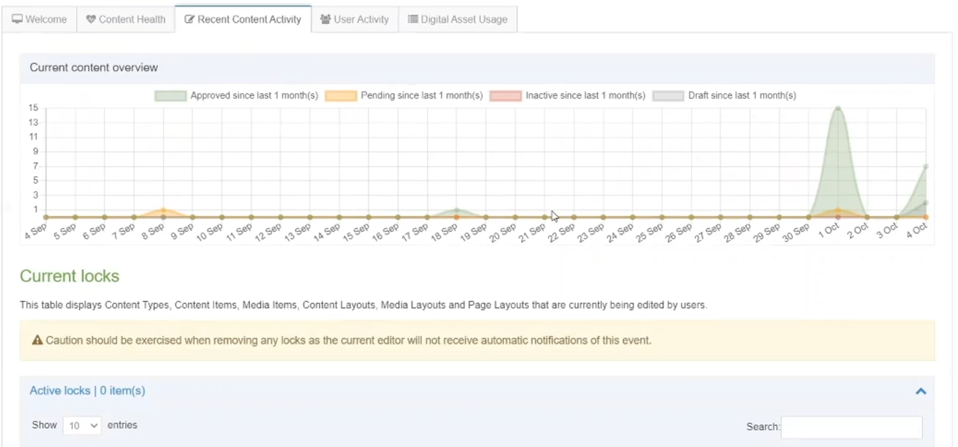
The recent activity tab shows what’s been going on in the past month and how often people are engaging with the T4 system. At the top is a graph showing an overview of the current content within the past month. It shows the amount of content items that were approved, pending, made inactive, and set as draft.
The first section underneath shows the content items that are currently being updated, and therefore locked. This section is only shown to administrators and they can unlock the content and make edits themselves. This is especially useful if you need to make an urgent edit but see that it is locked as someone else is currently editing it. If you’re unable to ask the person to stop editing the content item, you can unlock the content and make the edit yourself. In a case like this, any changes that the other person was making would be lost.
Underneath is the recent content activity section and shows content items that have been updated recently. This could be useful if you’ve made a change and it doesn’t look right after it has been published. It may be easier to find the content item here rather than navigating through the site structure again.
Finally, at the bottom of this tab is the recent layout activity section. This section is probably more useful for developers but like the recent content activity section, this section shows recent edits to page layouts and content types.
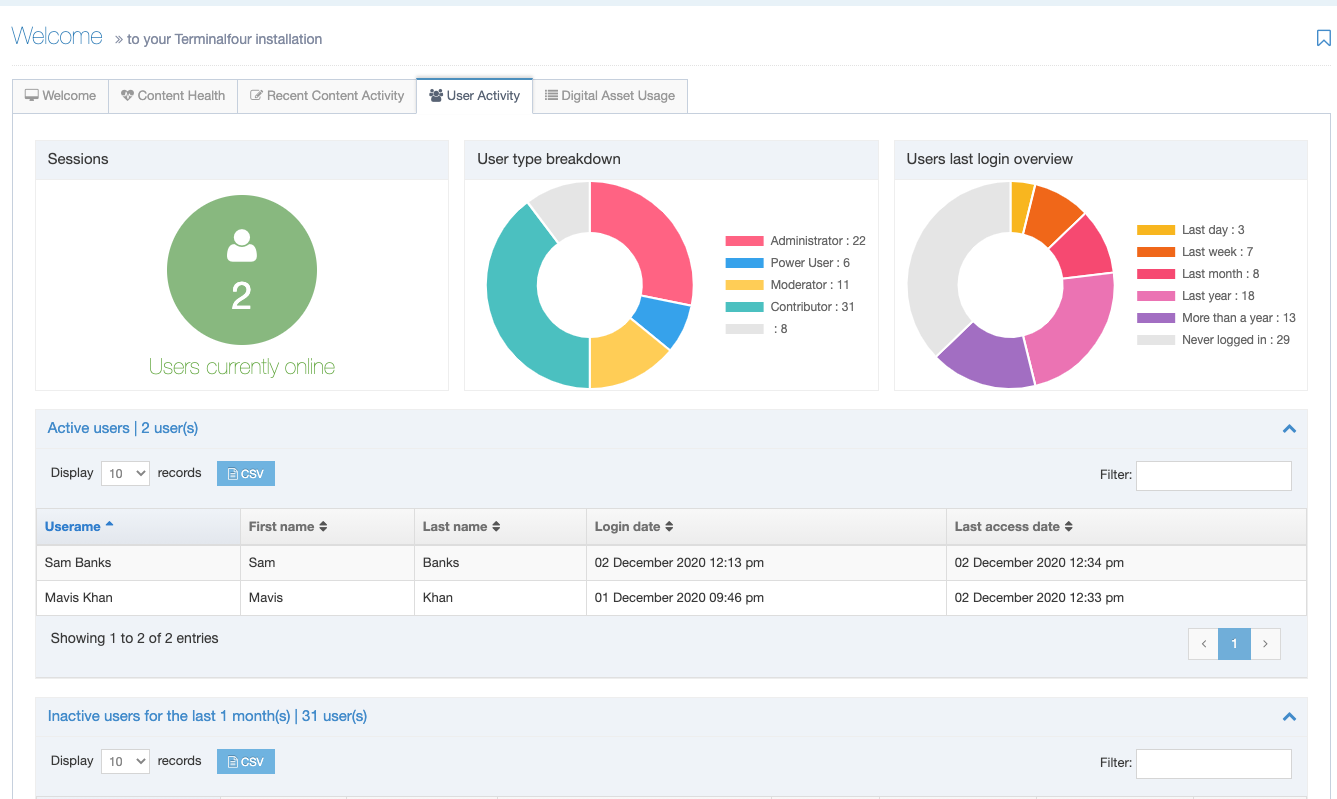
User activity
This tab shows information about the users within T4. At the top it shows graphics for online users, the breakdown of user roles, and information about when users last logged in. This tab is only viewable by administrators.
Underneath, the detailed view shows what users are currently online and below that are two sections for inactive users – users who haven’t logged in within the past month and users who have never logged in.
Digital asset usage
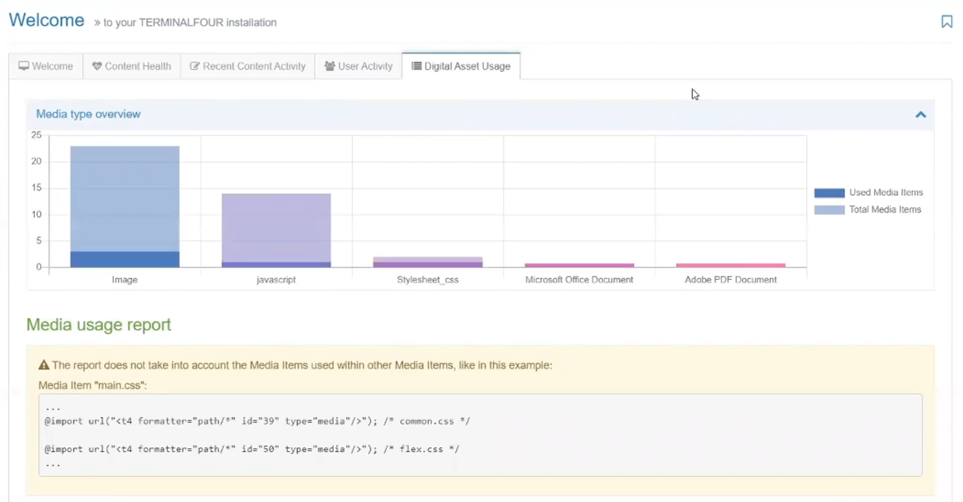
Finally, the digital asset usage tab which shows what media is currently being used and where. At the top is another graph showing the different media types, the total media items, and how many of them are being used on the site.
Below that is a detailed view of each media item and how it is being used – within a content item, a page layout, or a content type.
Conclusion
With all the features that the dashboard offers, we are very excited to try it out and see the data about our content and media within T4v8, and how our users are using the system. With the capability of creating additional widgets with programmable layouts, I am looking forward to seeing what other people create for their own T4v8 installations and how people build upon the existing widgets.