How new design has affected University news
In June 2016 we launched a new homepage that was more focused on external visitors. It introduced the idea of news and events being highlighted on a limited number of ’tiles’. The aim was to selectively promote specific news and events rather than than just a list of the past ten press releases and the next ten upcoming events. It also introduced the idea of ‘long form stories’, which are more like magazine articles with a longer life span than just a short press release.
One year on, how have visitors responded to the new design?
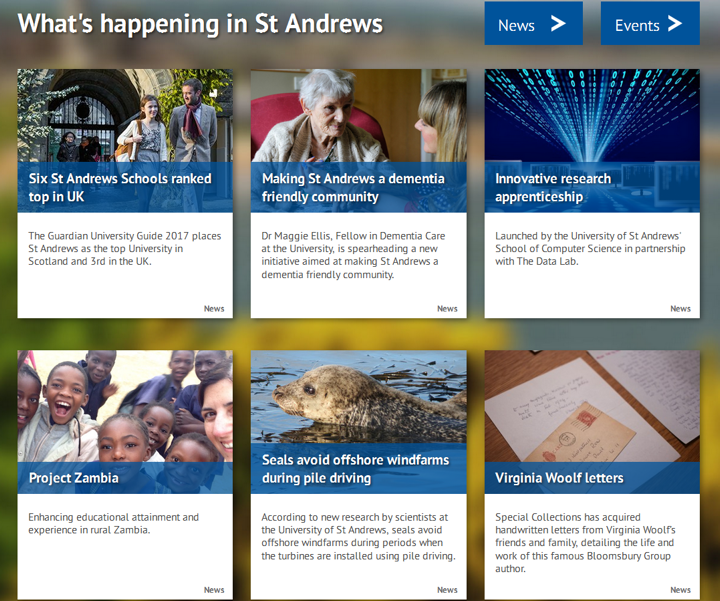
New homepage – 1 January 2016 and 20 May 2016
Overall, the number of pageviews News received increased by 21% and the bounce rate dropped by 16% compared to the same period before the launch of the homepage.
The following table shows traffic from tiles on the home page to the news articles between 1 January 2016 and 20 May 2016. The ‘% traffic from homepage‘ is calculated as the number of pageviews from the home page divided by the total pageviews.
The data shows that traffic to news items was boosted by at least 15%. The long form stories have proved to be popular, in particular, the Chinese Makars story received the longest time on page.
| Title | Total page views | Unique page views | Time on page | Page views from home page | % traffic from home page |
| New Principal | 6,513 | 6,086 | 2:39 | 1,220 | 19% |
| St Andrews: ‘best in Scotland’ | 3,619 | 3,132 | 2:26 | 672 | 19% |
| Best teachers of 2016 | 2,699 | 2,555 | 1:43 | 658 | 24% |
| New £10m marine lab | 2584 | 2,381 | 1:49 | 850 | 33% |
| Virginia Woolf letters | 1,098 | 622 | 1:11 | 165 | 15% |
| Chinese Makars | 770 | 685 | 3:44 | 370 | 48% |
| Orlando Furioso | 738 | 660 | 2:03 | 343 | 46% |
| Big in Japan | 728 | 634 | 1:02 | 261 | 36% |
| Prestigious award for St Andrews poet | 573 | 543 | 1:33 | 343 | 60% |
| Russell Morris | 517 | 452 | 1:33 | 123 | 24% |
| Women in science | 483 | 435 | 1:27 | 82 | 17% |
| Voices from the past | 345 | 320 | 1:06 | 123 | 36% |
| Carnegie Lecture 2016 | 204 | 194 | 1:28 | 69 | 34% |
| Award winning chemists | 161 | 144 | 1:43 | 69 | 43% |
Old homepage – 1 January 2015 and 20 May 2015
The following table shows the top 10 news articles between 1 January 2015 and 20 May 2015. The most popular news item received about a third of the traffic that the most popular item received in 2016. The percentage of page views attributed to visitors clicking on a link from the homepage is a lot less than the new design. Interestingly, the time spent on individual news articles is higher compared to the new design.
| Title | Total page views | Unique page views | Time on page | Page views from home page | % traffic from home page |
| League table success | 2,543 | 2,266 | 3:05 | 224 | 10% |
| Top names to be honoured | 1,468 | 1,389 | 3:05 | 56 | 4% |
| New stem technology | 1,415 | 1,317 | 3:56 | 70 | 1% |
| Bee brains | 1,142 | 1,034 | 4:03 | 14 | 1% |
| Adolescent health inequalities | 818 | 739 | 4:05 | 14 | 2% |
| Student wins undergraduate of the year | 783 | 741 | 1:46 | 280 | 38% |
| University historian meets the Queen | 699 | 630 | 2:12 | 252 | 36% |
| Sleeping sickness prevention in a nutshell | 670 | 635 | 2:07 | 56 | 8% |
| Seeing stars | 546 | 498 | 2:18 | 56 | 10% |
| Researchers break spinning world record | 526 | 487 | 2:20 | 84 | 16% |
Conclusion
Having a simpler homepage with fewer news items has successfully boosted the number of visits to the news items. However, it is clear that putting an item on the University homepage does not guarantee it is the most read. The article on award winning chemists only received 161 page views. We need to do further analysis to determine what makes a good title for a news item and to examine how referral traffic from social media and search engines affect traffic.