How to measure website data using a dashboard in Google Analytics
Last week digicomms received a support call asking what was the best way to measure website data. Instead of just providing them with access to Google Analytics and letting them get on with it, we created a dashboard which allowed the user to quickly access the information that mattered to them. This setup also meant that, going forward, the same information would remain up-to-date and easy to locate.
Why use a dashboard?
Using a dashboard in Google Analytics is not mandatory. But if you have been manually searching through various reports and tables for data, and you decide to set up a dashboard instead, you might be sitting there thinking, “why didn’t I do this earlier?”.
Saves time
Using a dashboard will save you time. Instead of laboriously working your way through the different sections of Google Analytics to find one element of data on a particular report, that report can instead be viewed instantly.
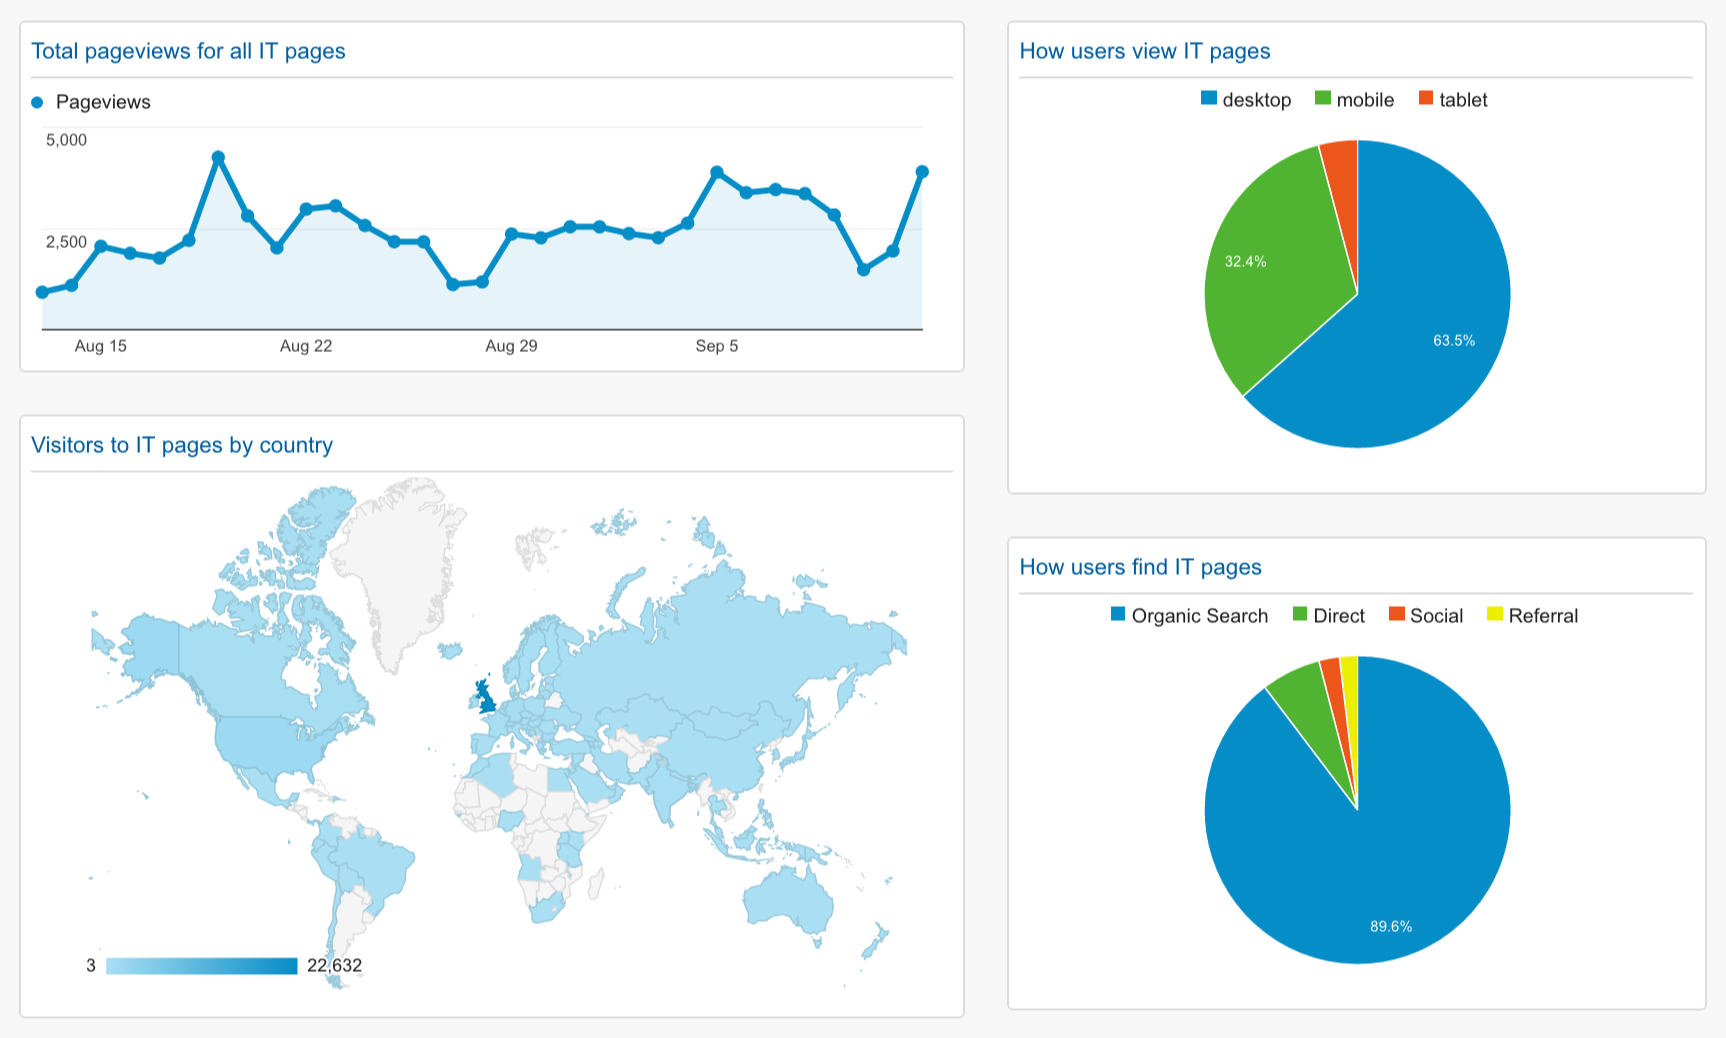
Plus, if the data you want to measure is strewn around many different reports and sections, it is not only time consuming, but it can be confusing to collate it all. With the dashboard, you can view all your different reports at a glance. For example, in this report, you can see referral information alongside demographic information:
See data in a way that makes sense to you
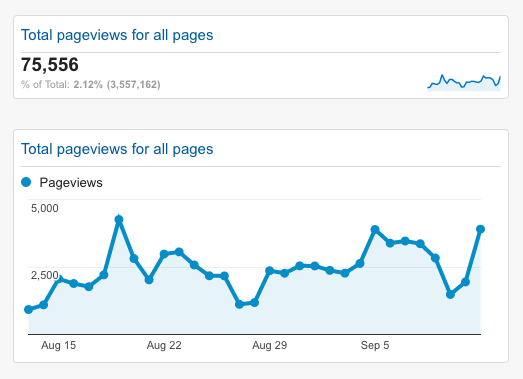
Once you’ve added the report to the page, you can customise how the data is presented. For example, in this dashboard I have a simple, bold metric which indicates the overall pageviews for the website, but beneath it, there is the same data, just as a timeline:
It’s not set in stone
Perhaps one of the most useful features is that after the dashboard has been created, reports can be added, removed or altered any time.
It can be shared
You can send people a link to the dashboard so they’ll have a copy they can interact with and make their own, or the data can be sent as a PDF where it will remain static.
How to create your dashboard
So now you know why you should create a dashboard, let’s look at how to go about this.
- Decide what you actually want to know about your website and users. Knowing this early on will determine what reports you’ll need to add and will save time when setting up the dashboard. You can add any report in Google Analytics to the dashboard, for example:
- number of pageviews your site receives
- how people have found your site (organic, referrals, etc.)
- type of device visitors are using to view your site.
- Gain access to Google Analytics. If you’re a member of staff and you would like access to the University’s analytics account, please email [email protected].
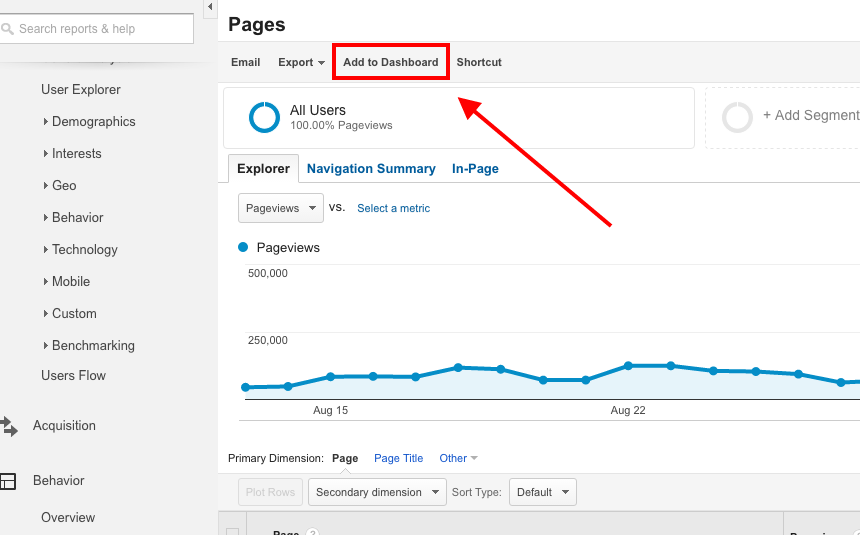
- Find a report you would like to add to the dashboard. Let’s start with pageviews. In Google Analytics go to Behaviour>All pages. Here you can search for a specific page to add and monitor, or just take the total pageviews for the whole site. Click on ‘Add to dashboard’. This process can be repeated on any report.
- Create your dashboard. After selecting ‘Add to Dashboard’ you will be asked to select a dashboard. If this is the first dashboard you’ve set up, select ‘New dashboard’ from the drop-down. You will also have the opportunity to name the dashboard at this point.

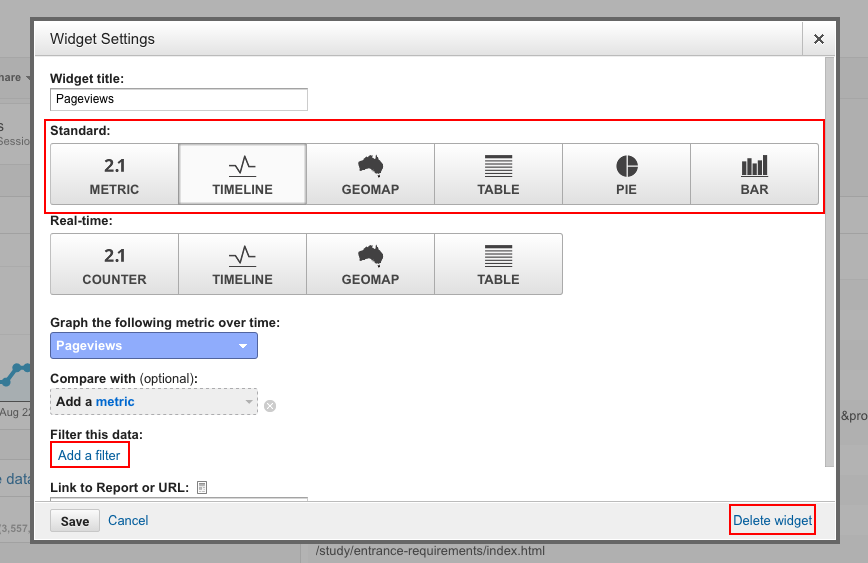
- Next choose which type of widget you would like to add. Adding both the timeline and the table means both will appear on the dashboard. After deciding this, select ‘Add to Dashboard’. You will then see your dashboard, including the two widgets you just added. Here you can drag and drop the widgets around the dashboard by selecting the widget and dragging it to where you want it.
- Customise your data widgets. You can alter the display of the widget so it shows only the key metric or so the data is presented as a pie chart by selecting the edit button on each widget. The settings box that appears will not only allow you to change the way the data looks, but also to compare and filter the data and delete or rename the widget.
Please email [email protected] if you would like a dashboard set up. Or, if you have any tips for creating the perfect dashboard, let us know in the comments below!