Google Data Studio training
In 2017, Google Analytics training was created as core course on the digital visa. The training introduced participants to key Google Analytics terminology and walked through creating a dashboard in Google Analytics. However, not long after, I became aware of Google Data Studio, another Google product which allows users to creatively visualise and share data. Essentially, the tool was a more user-friendly dashboard, and it enabled users to create analytics reports in a way that made sense to them. It became clear that the training should be changed to focus on Google Data Studio.
What you will learn
The aim of the new ‘Visualising data with Google Data Studio’ training session is to enable each participant to measure the performance of their website and understand user behaviour by creating an interactive report in Google Data Studio.
By the end of the session, participants will be able to:
- define key terms within Google Analytics such as ‘organic search’ and ‘pageview’ .
- create a report in Google Data Studio .
- add and edit widgets within the report .
- understand what each widget can show.
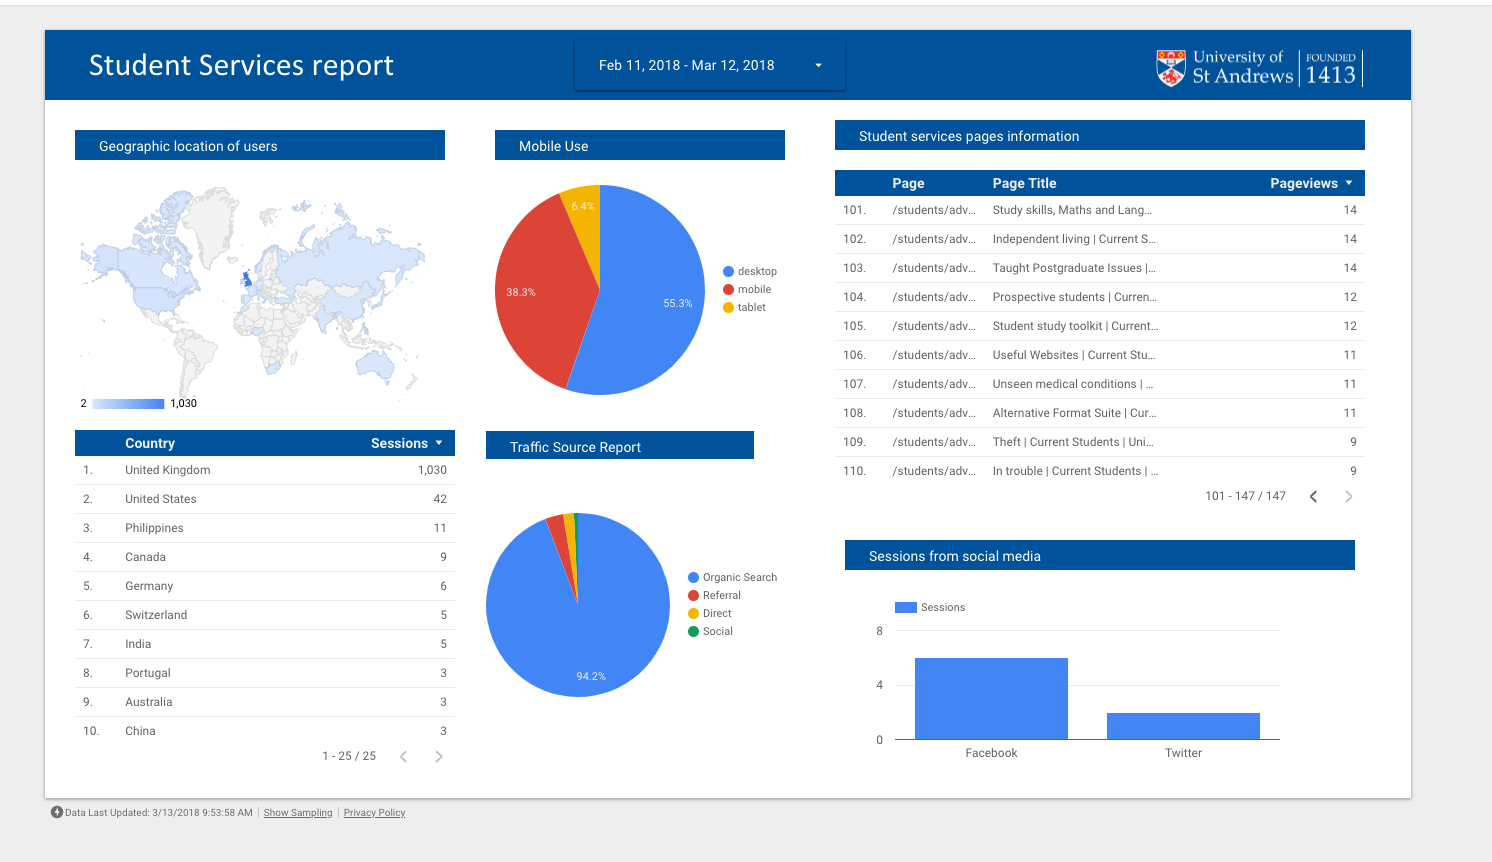
When the course ends, learners will have an interactive dashboard that they can edit and share with their colleagues. And the great thing is, those colleagues don’t need to have access to Google Analytics, or even a Google account, to see that data. Take a look for yourself (by the way, this is not University data).
Before participants create the report, I introduce both Google Analytics and Google Data Studio. Providing some background information on Google Analytics is still important, as Google Data Studio pulls data through from there, and the terminology used within Data Studio is the same as Analytics. So, when we go through the process of adding a traffic widget to the report, we explore terminology such as ‘direct’, ‘organic’, ‘referral’, etc. Plus, we still use Google Analytics here in digicomms, and staff in other departments are also free to use Analytics rather than Data Studio if they prefer.
What you will take away
As well as a completed, completely editable report, participants take away a ‘Google Analytics cheat sheet’ and a document which covers everything that we worked on in the lesson. The document also includes links to walkthrough videos which recreate the widgets created.
How to sign up
Current members of staff can sign up to the course via PDMS when it becomes available. The plan is to run the course approximately six times per year. Digital visa participants will have priority of place on a digital visa course until a week before the course start date. To sign up for the digital visa, contact Jennifer Hamrick on [email protected].