Google Analytics training: an overview
Recently, the digital communications team launched the digital visa, a programme of training sessions which enables staff to feel competent working on digital communications projects. One of the courses within the visa is Google Analytics: creating a dashboard – this post outlines in more detail what the Google Analytics training session covers.
The session
By the end of every training session, each participant walks away with their own Google Analytics dashboard. A dashboard allows users to quickly access relevant data within Google Analytics.
Creating a dashboard means collating specific reports in one place, with the main purpose of having all the most important and most frequently used reports at hand. The training session covers five reports:
- Who visits your site? (Location report)
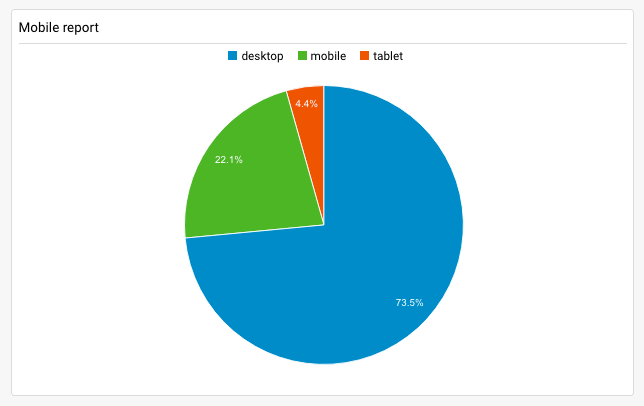
- How do users visit your site? (Mobile device report)
- How many pageviews does your site receive? (Pageviews report)
- How do users reach your site? (Traffic source report)
- Number of sessions from social media. (Social media report)
With each report, participants are shown what the report looks like in the dashboard, what the report can tell you about a site, and how to add the report to the dashboard.
Once a report has been added, participants also have the option of editing the style of each widget in the dashboard so they present the data in a suitable manner. For example, instead of showing the mobile device report as a table, participants are shown how to change it to a pie chart.
Alongside creating a dashboard, participants are introduced to key terminology associated with the tool. For example:
- bounce rate
- entrance
- exit rate
- organic
- pageview
- referral
- session
- unique pageviews.
Additional reports
There is time allocated in the training session to look at any additional reports that users would like to include but have not been covered in the session. For example, in the first training session, one participant asked if it were possible to monitor PDF downloads. The whole class was shown how to implement this report in the dashboard.
Resources
After the training session, each participant is emailed a training pack which includes information about the reports that were covered in the lesson, along with videos showing the steps involved if additional reports need to be added.
If you’re interested in signing up for Google Analytics: creating a dashboard or any of the other courses in the digital visa, please email [email protected].