How we are using Hotjar to improve our web pages
We have been actively using Hotjar for the past six months to record heatmap data and discover new insights into how our web pages are being used. This article explains how we are currently using the tool, what updates Hotjar are rolling out and how we intend to make the best use of these changes.
When we initially set up the tool, we restricted it to only record visitor behaviour on the University web pages intended for external audiences, but we quickly expanded this to include internal pages for staff and students, alongside the News and Events websites.
With so much data being captured, it is easy to feel overwhelmed, but the need to configure heatmaps in advance of them recording information helped our focus. Indeed, this application seems to be far better suited as a targeted method of answering specific questions about content and user interface design rather than monitoring the performance of web pages on an ongoing basis.
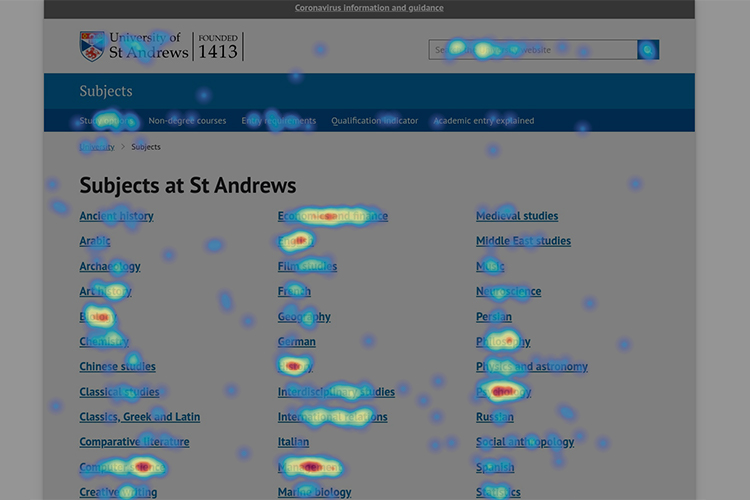
The main feature of Hotjar is heatmapping, and this is what we have been primarily using. Heatmaps are screenshots of a specific URL (split across desktop, tablet and mobile) overlaid with coloured graphics to signify where users are clicking or tapping, where they move their pointer, and how far they scroll down the page.
We have set up a number of heatmaps for the following purposes:
- Observing how pages with high traffic or important information are being interacted with and how far down each page is being viewed.
- Measuring the success of newly launched websites and web applications.
- Validating that the current content patterns defined in the digital pattern library are being used as intended.
- Measuring the success of changes to the design of any content patterns.
The heatmaps provide us with information that could only otherwise be collected through numerous user testing sessions. They allow us to greatly increase both the number of pages being tested and the size and diversity of the user group providing the data.
Some of our early observations include:
- Behaviour changes between mobile and desktop users can be clearly seen on interactive pages such as the website search, with mobile users more likely to search again to find a suitable top result rather than scroll through other results.
- Some non-interactive elements are being clicked which may signify that the design implies interaction or that users are seeking additional information that is missing on the page.
- Long pages show a noticeable drop-off in scroll depth, stressing the importance of prioritising content. We recently changed the design of the sticky horizontal nav pattern used on a number of long pages to combat this issue and to improve support with our CMS and with mobile devices. Early indications show that this new navigation design has increased scroll depth on mobile devices for these pages along with increased navigation interaction for all device types.
Hotjar recently announced a number of major changes to their service offering which aims to make their tools more focused and powerful. The form and funnel tracking features have been removed, but as we had not been using these yet, this seems to match Hotjar’s own observations. We have been experimenting with the feedback feature but have not found this particularly useful yet, with little user engagement and not enough flexibility in changing the design of the feedback prompt.
The main change that will impact us is the new continuous heatmaps feature. Hotjar is switching from pre-defined heatmaps to an on-demand, capture everything method. This will require us to greatly narrow the scope of where we deploy Hotjar at any one time to ensure our plan’s recording limit isn’t diluted across the large number of pages on the University website. For example, ahead of starting work on redeveloping the Careers website, we have configured Hotjar to only record sessions that include a visit to at least one page within the Careers site. This will still require a certain amount of forward planning to make configuration changes in advance of when we will need data, but it should be much less work than setting up multiple manual heatmaps for individual pages.
The continuous heatmap feature is still in its early stages, but hopefully some of the features from the manual heatmaps and recordings are included as soon as possible. Currently, continuous heatmaps have no filtering options and are unable to specify date ranges for a particular problem. With manual heatmaps, you can control the start and end of a recording period and clearly label each heatmap; this is important when the design of a page changes or some other anticipated factor warrants the segmentation and comparison of different date ranges of the same heatmap. Even if continuous heatmaps will include a date range filter, we are going to need to maintain some form of documented record of significant changes for cross-referencing.